Writing the whole problem, to avoid asking a question when in reality I needed an answer to a whole different question, and just didn't know how to ask. I have a lot of data about my daily life and I want to find correlations between different tracked variables. Or rather those variables that are correlated between each other, for further deeper inspection. Each of them have a precise timestamp and sometimes a value attached to them.
I have no idea where to start, I can program stuff in python, but I don't have much(possibly any) knowledge in statistics. And I'm looking for a direction to research, that would help me solve this task.
More about the data:
I have a log of my body temperature over the last 5 months, but I only logged it sometimes, when I felt bad i. e. - Not all days have values and the timing of measurement is irregular. So, if a day doesn't have a value it means I forgot to log it or I felt good - it's assumed it was around 36.6C etc. Or for example if I felt pain somewhere - if it has an entry it means I felt it and no entry means either no pain or I forgot, since the logging wasn't perfect.
So, when comparing these types of series to other series, should I pad them with default values in between or leave them as they are?
I also have a bunch of other measurements like what food I ate, how long I've slept, and logs of other important regular events.
Each entry has a timestamp and is either of type(value - hours slept, mood level) or of type - happened and logged or not logged at all.
I have a lot of them and I would like to find those that correlate between each other for further deeper look into them, plus if I just plot them, it's not always possible to see the correlation without some processing and a smart metric, I think. so, say I have
Temperature in Celsius
2018-05-29 11:59:00   35.7
2018-05-29 20:42:00   36.7
2018-05-29 21:23:00   36.6
2018-05-29 23:20:00   36.9
2018-05-30 11:03:00   35.8
2018-05-30 21:08:00   36.8
2018-05-30 23:34:00   36.7
2018-05-31 01:27:00   36.8
2018-05-31 17:32:00   36.4
2018-05-31 20:41:00   36.5
2018-06-01 01:05:00   37.0
2018-06-01 01:09:00   37.2
2018-06-01 01:40:00   36.7
2018-06-01 14:10:00   36.8
2018-06-01 15:58:00   36.6
2018-06-01 16:59:00   36.2
2018-06-01 22:11:00   36.1
2018-06-02 03:08:00   36.1
Eating something sweet
2018-05-21 20:29:00    1.0
2018-05-21 22:12:00    1.0
2018-05-21 23:47:00    1.0
2018-05-24 23:19:00    1.0
2018-05-25 15:59:00    1.0
2018-05-29 20:01:00    1.0
2018-05-30 01:51:00    1.0
2018-06-02 19:28:00    1.0
2018-06-03 20:29:00    1.0
Some other measurement that has values between -5 and 3
2018-05-27 21:30:00   -1.0
2018-05-27 21:58:00    0.0
2018-05-27 22:44:00   -2.0
2018-05-28 00:54:00   -1.0
2018-05-28 23:17:00    1.0
2018-05-29 13:09:00   -1.0
2018-05-29 19:23:00   -1.0
2018-05-29 21:46:00   -1.0
2018-05-30 20:23:00   -1.0
2018-05-31 13:38:00   -1.0
2018-05-31 15:19:00   -1.0
2018-05-31 17:08:00   -1.0
2018-05-31 18:27:00    0.0
2018-05-31 20:39:00   -1.0
2018-06-01 20:07:00   -2.0
2018-06-02 12:36:00   -1.0
2018-06-02 12:52:00   -3.0
2018-06-03 14:45:00   -2.0
2018-06-03 15:16:00   -1.0
And lots of the same sort, around 100 and more of not regularly occurring events, but they are still important and usually have a greater and less delayed impact, than those that occur regularly, how do I check each one of them against each other or each one of them againast a combination of others for correlation?
I can think of trying to transforming them into averages over a day, or number of entries per day for just event tracker without value. But it can be done later. I need some help with giving me directions where to look and what to read and what to try.
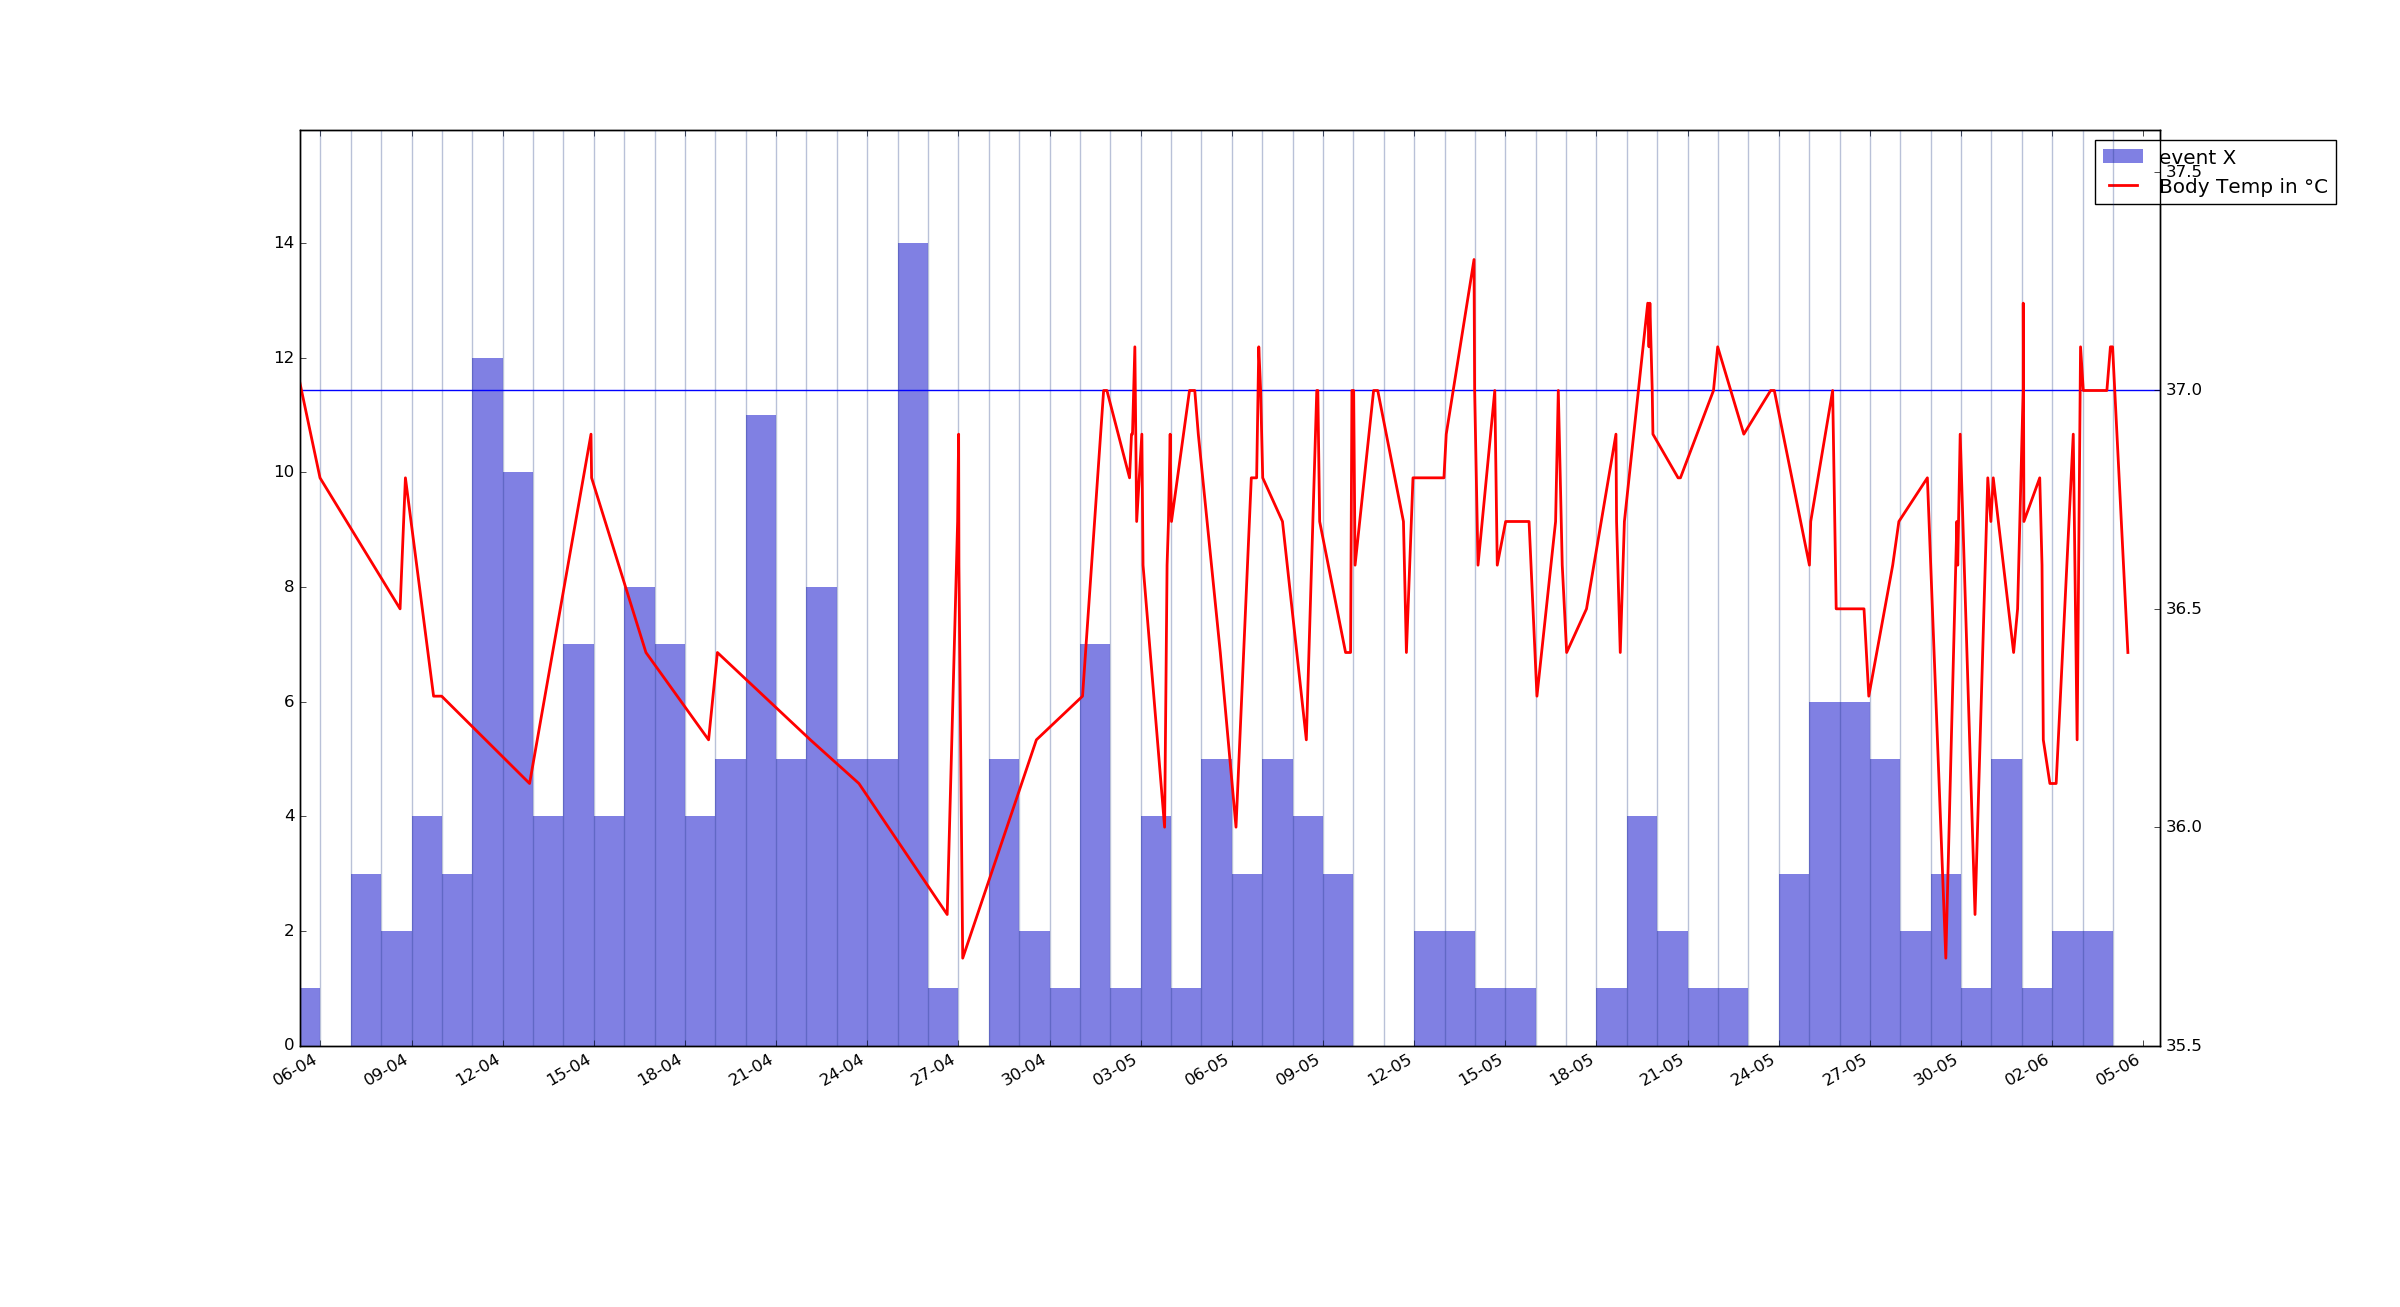
As an example, here's a plot of my body temperature and a barplot of event X grouped by 24hour intervals over last 2 months. I want to know if they are correlated or not. event X has a precise time of logging and a value connected to it - from -5 to 3 but I'm not sure how to visualize it best yet.

UPD:
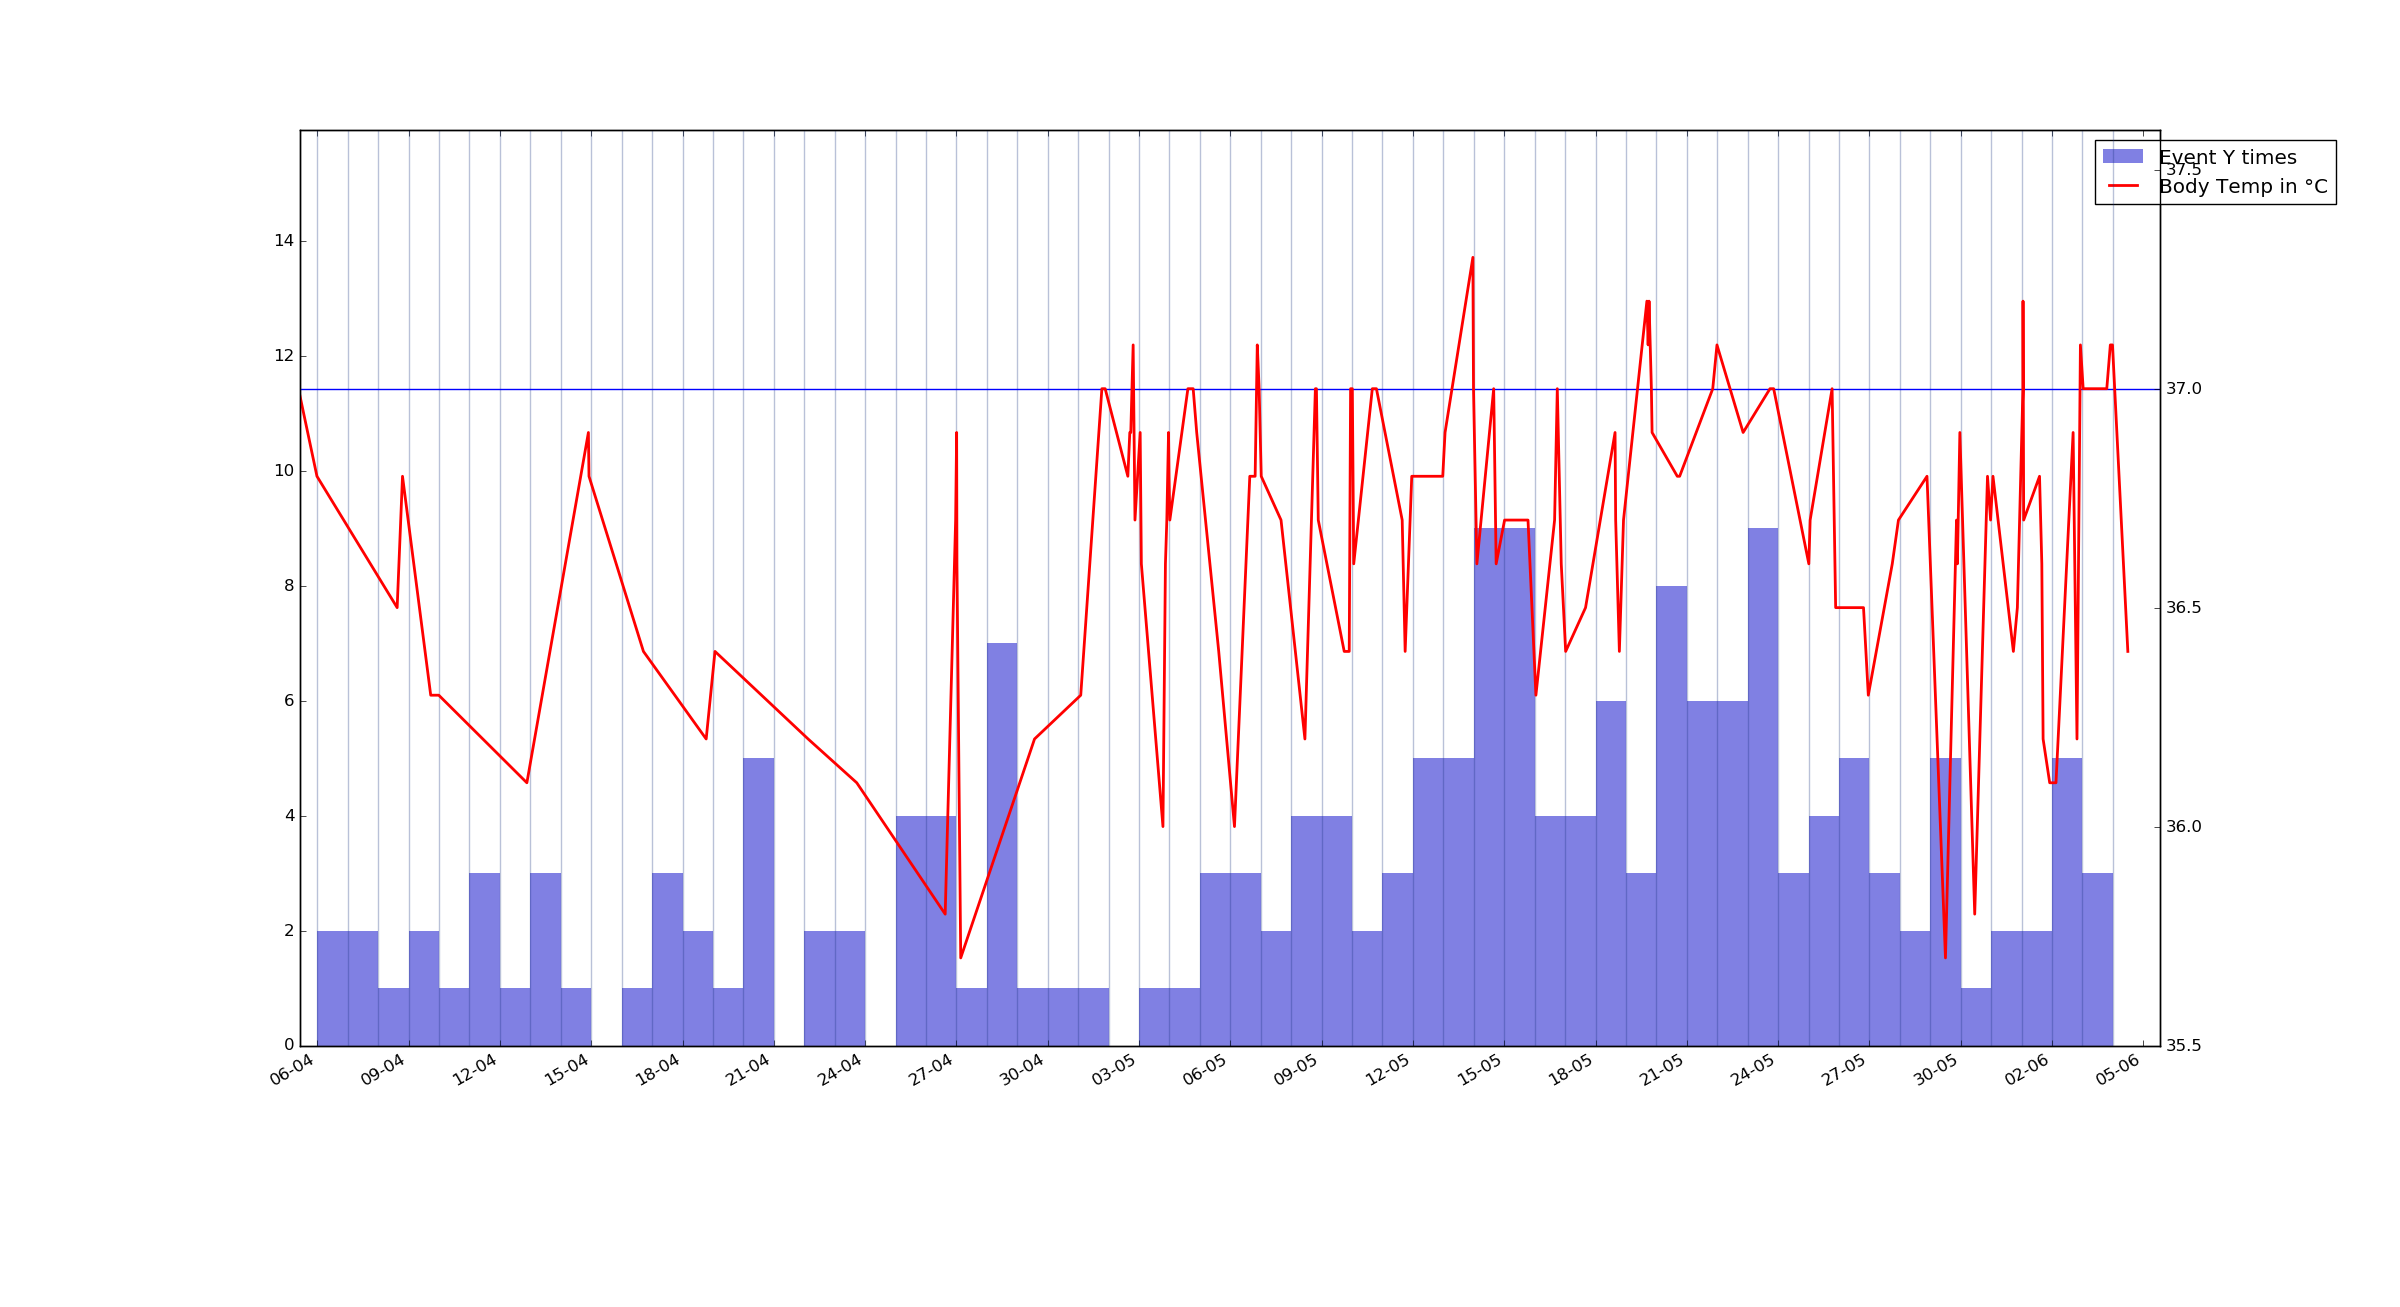
One more example plot - another event measured in hours, but here it counts how many times it was logged. Event Y.

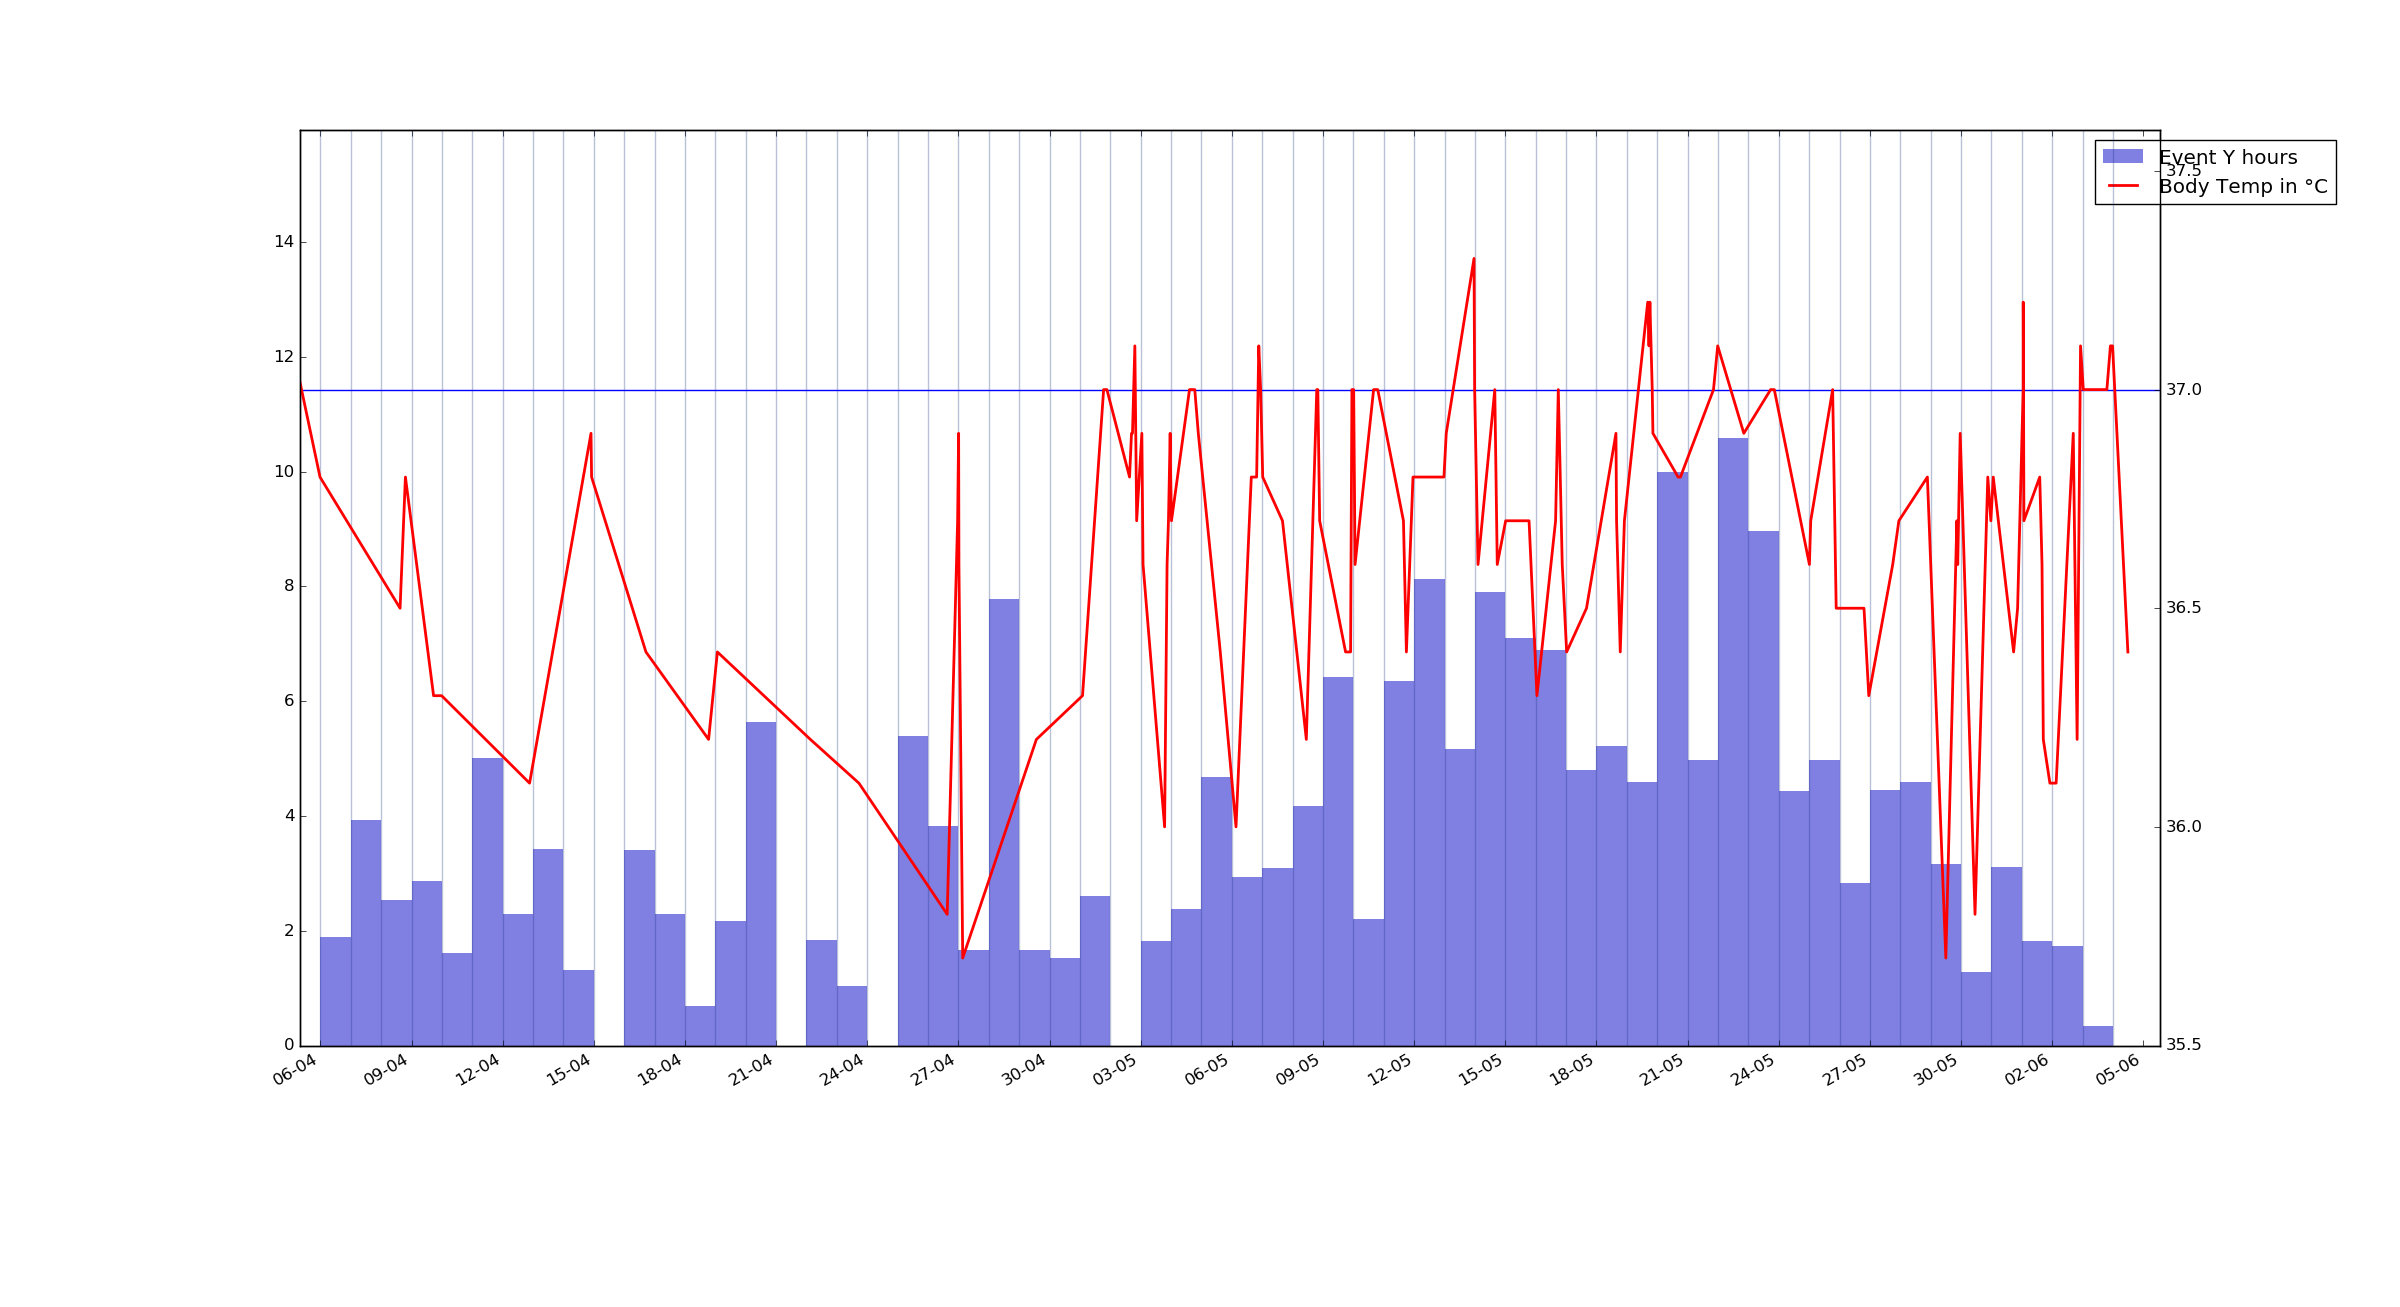
Event Y again, but this time it's summed value for each day(for this event)

So far the only idea that came to me but I haven't tried to implement it is to use a reccurent neural network like LSTM, split each day into 10 minutes pieces, and designate an input for each of the tracked variables and feed them into it, and teach it to predict the next step. After I train it, change/remove some of the variables and see how the overall picture changes. And of course I will have to try and avoid overfitting it since it's just 6 months of data. But I don't think it's the optimal solution. I know nothing about statistics and there should probably be a method to do what I want already. But I'm not even sure how to google for it.
Would something called "Cross-Correlation" fit my case?
