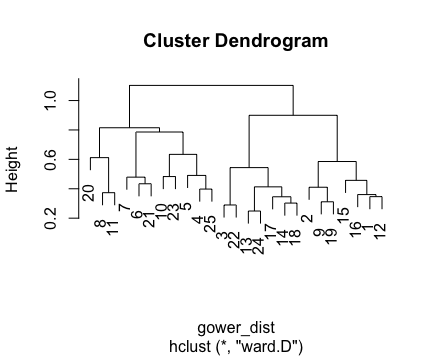
I am trying to apply Ward's clustering on a mixed types dataset, and wanna explain what I did (maybe helpful to others), and I have some questions regarding this analysis, mainly how to validate my clusters.
So, let me explain what I did in detail:
I started with a dataset containing 53 variables. These variables are either numerical or binary. The first variable contains the participant number, so will not be used in the clustering. I directly coded the categorical data into binary variables so that I didn't have to transform these variables.
Then I checked for normality of the variables for all numerical variables, using the Shapiro-Wilk test. Significance values below 0.05 will be log-transformed in the next step. Binary variables don't need a normality check.
I calculated distance using the
daisylibrary. Here, I log-transformed the variables with a value lower than 0.05 in the second step with 'logratio', the other variables were appointed as asymmetric binary and symmetric binary. I read that Gower distance is an appropriate metric for mixed data types, and that's why I carried out this step this way.
gower_dist <- daisy(mydata[, -1], metric = "gower", type = list(logratio = c(4,5,6,7,8,9,10,11,12,13,17,24,25,26,44,45,49,50,51,52), asymm = c(14,15,16,18,19,20,21,23,27,28,29,30,31,32,34,35,36,37,38,39,40,41,42,43,46,47,48), symm = c(1,3)))
- Then I used Ward's method for clustering, and I plotted a dendogram with the results.
hc1 <- hclust(gower_dist, method = "ward" )

plot(hc1) # display dendogram
This resulted in the following output:
I think that I am in the right direction with my analysis, but have some problems with finding the right number of clusters. I wanted to use pvclust() since it provides p-values for hierarchical clustering, and that is what I am interested in. However, it seems that this package is not usable when using Gower distances. Does anyone know another way to find p-values in R for Ward's clusters using the Gower distance?
Next to this, I have some small doubts on the correctness of my analysis. These are the following:
- I read that using binary variables can be problematic in https://www.researchgate.net/publication/223532418_Hierarchical_clustering_of_mixed_data_based_on_distance_hierarchy. I assumed that with a high dimensional data set, this would not be a large problem, is that true?
- According to https://www.ncbi.nlm.nih.gov/pmc/articles/PMC4120293/ log transforming data does not help make data less variable or more normal and may, in some circumstances, make data more variable and more skewed. Is it still wise to apply log transformation to the variables? Also, I think that using Ward's method is wise to use for high dimensional datasets, is that true?
- I wanted to use 'Partial data cluster analysis' to deal with missing values in the data (as explained in https://www.displayr.com/5-ways-deal-missing-data-cluster-analysis/), but I am not sure how I dealt with missing data the way I carried out the analysis now. This also doesn't seem to be documented.

