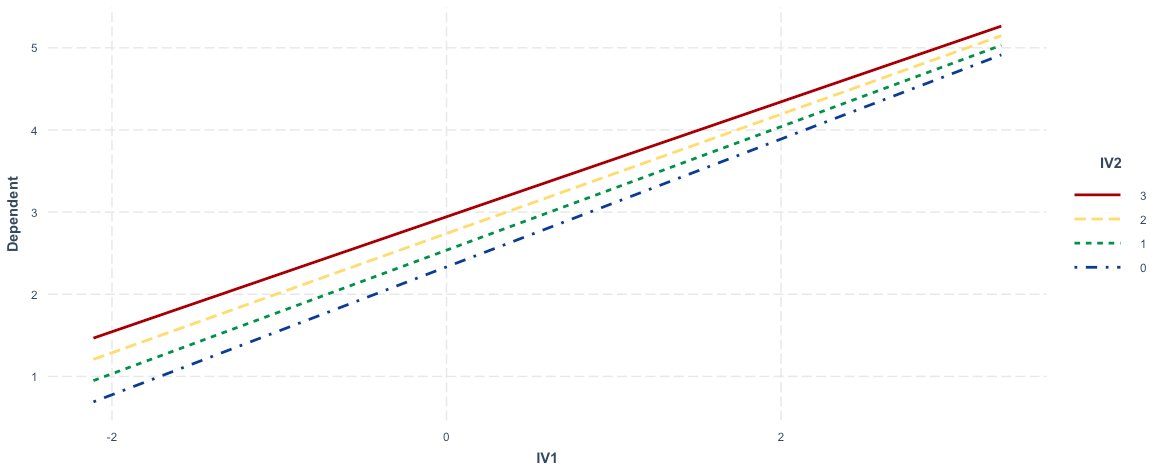
I tried to test Cross-level interactions using lmer package.
age.gm, gender, race are controls and
IV.1.gm is the individual-level independent variable and IV.2.gm is the contextual-level independent variable.
The results look like this
Random effects:
 Groups   Name        Variance Std.Dev.
 state    (Intercept) 0.03117  0.1765
 Residual             0.78356  0.8852
Number of obs: 7176, groups:  state, 51

Fixed effects:
                                       Estimate   Std. Error           df t value             Pr(>|t|)
(Intercept)                           2.2894163    0.0706558  289.2703817  32.402 < 0.0000000000000002 ***
age.gm                               -0.0031718    0.0006319 7120.8153804  -5.019     0.00000053129273 ***
gender                               -0.0015704    0.0208730 7134.5146671  -0.075               0.9400
race                                  0.0640425    0.0254715 7145.4305624   2.514               0.0119 *
IV.1.gm                               0.7781568    0.0105103 7120.8922774  74.038 < 0.0000000000000002 ***
IV.2.gm                               0.2033964    0.0218219   42.4926330   9.321     0.00000000000784 ***
IV.1.gm:IV.2.gm                      -0.0261582    0.0057053 7118.3869626  -4.585     0.00000462014480 ***
---
Signif. codes:  0 ‘***’ 0.001 ‘**’ 0.01 ‘*’ 0.05 ‘.’ 0.1 ‘ ’ 1

Correlation of Fixed Effects:
            (Intr) age.gm gender race  IV1.gm. IV.2.gm.
age.gm       0.047
gender      -0.753 -0.003
race        -0.274 -0.170  0.013
IV.1.gm      0.003 -0.066  0.036 -0.099
IV.2.gm     -0.433  0.005 -0.005 -0.027 -0.002
IV.1.gm:...  0.004  0.008  0.004 -0.034 -0.745  0.005
It's quite counter-intuitive, that the positive main effects of IV.1.gm and IV.2.gm are changed into negative effects on the dependent variable when I tested the interactions. Note that all variables are standardized, and there's no multicollinearity issue.
So I plotted the interaction effects, and it looks much confusing.
The visualization shows there are positive interaction effects. Then why do they show negative interaction terms in the regression table?

