Bumped by Community user
added 483 characters in body
Source Link
noone
  • 53
  • 1
  • 5

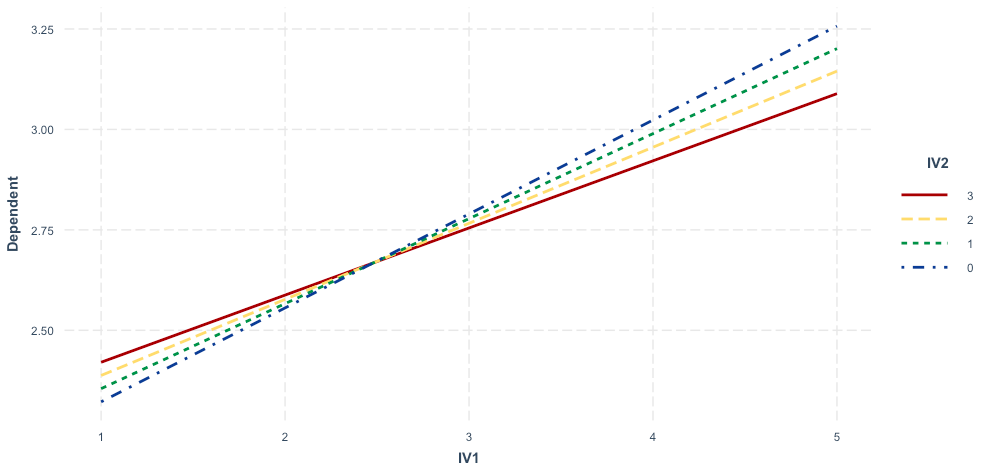
It's quite counter-intuitive, that the positive main effects of IV.1.gm and IV.2.gm are changed into negative effects on the dependent variable when I tested the interactions. Note that all variables are standardized, and there's no multicollinearity issue. IV.1.gm is group-mean centered and IV.2.gm is grand-mean centered as I learned in the stat class.

enter image description hereenter image description here

The visualization shows there are positive interaction effects. Then why do they show negative interaction terms in the regression table?

*I did the test again without standardization. The results are the same so I didn't attach them here. But the interaction plot looks different.

enter image description here

But isn't it still look like a positive interaction plot? I am still confused about why regression coefficients for interaction term is negative.

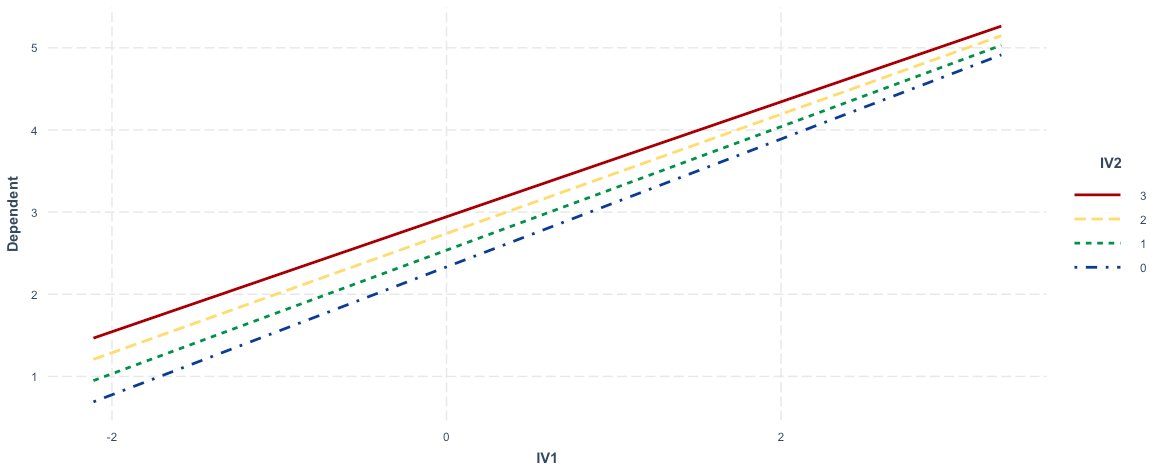
It's quite counter-intuitive, that the positive main effects of IV.1.gm and IV.2.gm are changed into negative effects on the dependent variable when I tested the interactions. Note that all variables are standardized, and there's no multicollinearity issue.

enter image description here

The visualization shows there are positive interaction effects. Then why do they show negative interaction terms in the regression table?

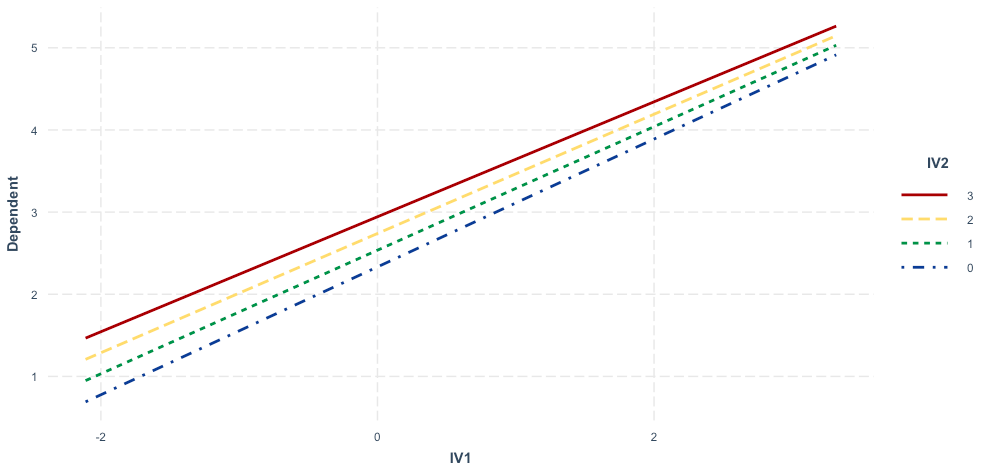
It's quite counter-intuitive, that the positive main effects of IV.1.gm and IV.2.gm are changed into negative effects on the dependent variable when I tested the interactions. Note that all variables are standardized, and there's no multicollinearity issue. IV.1.gm is group-mean centered and IV.2.gm is grand-mean centered as I learned in the stat class.

enter image description here

The visualization shows there are positive interaction effects. Then why do they show negative interaction terms in the regression table?

*I did the test again without standardization. The results are the same so I didn't attach them here. But the interaction plot looks different.

enter image description here

But isn't it still look like a positive interaction plot? I am still confused about why regression coefficients for interaction term is negative.
edited title
Link
noone
  • 53
  • 1
  • 5

Interpreting cross-level interactions in mixed model in R (lmer)

Source Link
noone
  • 53
  • 1
  • 5
Loading