2
$\begingroup$

I tried to test Cross-level interactions using lmer package. age.gm, gender, race are controls and IV.1.gm is the individual-level independent variable and IV.2.gm is the contextual-level independent variable.

The results look like this

Random effects:
 Groups   Name        Variance Std.Dev.
 state    (Intercept) 0.03117  0.1765  
 Residual             0.78356  0.8852  
Number of obs: 7176, groups:  state, 51

Fixed effects:
                                       Estimate   Std. Error           df t value             Pr(>|t|)    
(Intercept)                           2.2894163    0.0706558  289.2703817  32.402 < 0.0000000000000002 ***
age.gm                               -0.0031718    0.0006319 7120.8153804  -5.019     0.00000053129273 ***
gender                               -0.0015704    0.0208730 7134.5146671  -0.075               0.9400    
race                                  0.0640425    0.0254715 7145.4305624   2.514               0.0119 *  
IV.1.gm                               0.7781568    0.0105103 7120.8922774  74.038 < 0.0000000000000002 ***
IV.2.gm                               0.2033964    0.0218219   42.4926330   9.321     0.00000000000784 ***
IV.1.gm:IV.2.gm                      -0.0261582    0.0057053 7118.3869626  -4.585     0.00000462014480 ***
---
Signif. codes:  0 ‘***’ 0.001 ‘**’ 0.01 ‘*’ 0.05 ‘.’ 0.1 ‘ ’ 1

Correlation of Fixed Effects:
            (Intr) age.gm gender race  IV1.gm. IV.2.gm.
age.gm       0.047                                   
gender      -0.753 -0.003                            
race        -0.274 -0.170  0.013                     
IV.1.gm      0.003 -0.066  0.036 -0.099              
IV.2.gm     -0.433  0.005 -0.005 -0.027 -0.002       
IV.1.gm:...  0.004  0.008  0.004 -0.034 -0.745  0.005

It's quite counter-intuitive, that the positive main effects of IV.1.gm and IV.2.gm are changed into negative effects on the dependent variable when I tested the interactions. Note that all variables are standardized, and there's no multicollinearity issue. IV.1.gm is group-mean centered and IV.2.gm is grand-mean centered as I learned in the stat class.

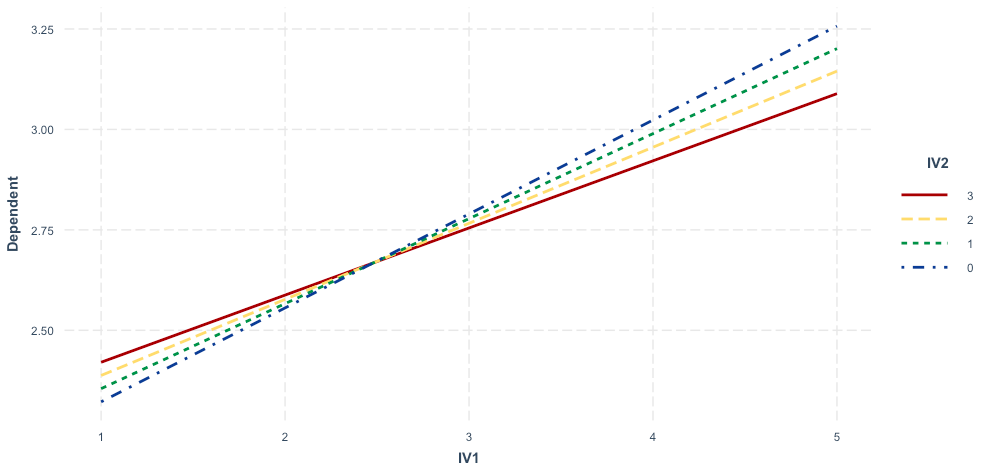
So I plotted the interaction effects, and it looks much confusing.

enter image description here

The visualization shows there are positive interaction effects. Then why do they show negative interaction terms in the regression table?

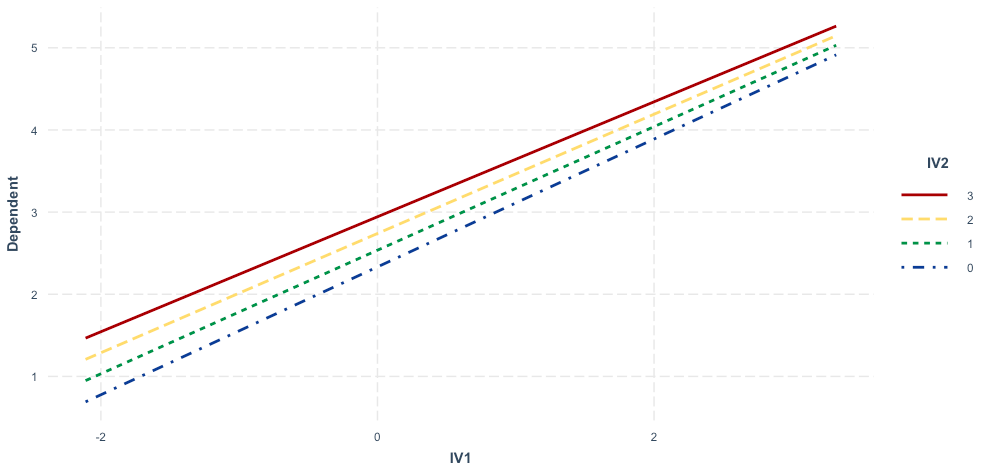
*I did the test again without standardization. The results are the same so I didn't attach them here. But the interaction plot looks different.

enter image description here

But isn't it still look like a positive interaction plot? I am still confused about why regression coefficients for interaction term is negative.

$\endgroup$
1
  • $\begingroup$ This does not address your question, but it is important when constructing cross-level interactions. Did you include IV.1.gm as a random slope in your lmer model statement? If not, you need to do so. See academic.oup.com/esr/article-abstract/35/2/258/5306121 $\endgroup$
    – Erik Ruzek
    Commented Feb 3 at 20:51

1 Answer 1

0
$\begingroup$

The negative coefficient of the interaction term means decreasing slope with IV.2.gm as shown in the graph - slope decreases as IV.2.gm increases. It means that the effect of IV.1.gm on the dependent variable decreases as IV.2.gm increases.

Note that the estimated equation is $$ \hat{Y} = 2.289 + 0.778 * IV.1.gm + 0.203 * IV.2.gm - 0.026 * IV.1.gm * IV.2.gm + \cdots $$ and the slope is $$ \frac{\partial \hat{Y}}{\partial IV.1.gm} = 0.778 - 0.026 * IV.2.gm $$ As IV.2.gm increases by 1, the slope decreases by 0.026.

$\endgroup$
2
  • $\begingroup$ Thanks a lot! It makes sense to me that IV.1.gm and IV.2.gm dampen each other's effect but the overall positive effect does not fade away... $\endgroup$
    – noone
    Commented Dec 13, 2021 at 5:25
  • $\begingroup$ @noone Your comment sounds like, for some reason, you expected that the overall positive effect should fade away. Why would you have expected that? As to you graphs: you said that all the variables are "standardized", but how was this done? You say you used grand mean centering for the IV.2.gm, but if that is true, I would expect to also see negative values for IV.2.gm in the graphs, but you show only positive values, which is a bit strange. Same holds for IV.1.gm. $\endgroup$
    – BenP
    Commented Jun 9 at 9:31

Your Answer

By clicking “Post Your Answer”, you agree to our terms of service and acknowledge you have read our privacy policy.

Not the answer you're looking for? Browse other questions tagged or ask your own question.