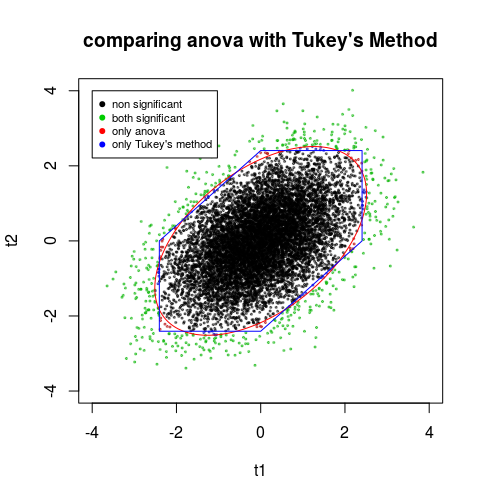
Here is a visualisation for testing the hypothesis $\mu_1 = \mu_2 = \mu_3$ which may be tested based on 3 seperate pairwise comparisons of the means by using individual t-tests based on t statistics that uses a pooled estimate for the deviation.
We simulate the distribution of the outcome of these t-tests for 3 samples of size 20 taken from a standard normal distribution. (See Comparing two, or more, independent paired t-tests) and we plot two of those t-values (the other is linearly dependent on the other two, $t_{1} + t_{2} + t_{3} = 0$).
What Tukey's method does, and also Anova, is defining a region such that given the hypothesis, $\mu_1=\mu_2=\mu_3$ (and the assumptions of normal distribution and equal variance), the outcome will pass some $p$ percent of the time outside the boundary. If the hypothesis is wrong then typically the outcome will be outside the boundary much more often.
Tukey's method uses the boundary based on the maximum magnitude of the t-statistics
$$q = max(|t_1|,|t_2|,|t_3|)$$
Anova will use a boundary on the overall sizes of the t-statistics
$$F = \frac{t_1^2+t_2^2+t_3^2}{3}$$
Tukey's method will be more sensitive to situations where few $\mu_i$ are different from the rest. Anova will be more sensitive when multiple $\mu_i$ are different.

