27
$\begingroup$

What are good ways to visualize set of Likert responses?

For example, a set of items inquiring about the importance of X to one's decisions about A, B, C, D, E, F & G? Is there something better than stacked bar charts?

  • What should be done with responses of N/A? How might they be represented?
  • Should the bar charts report percentages, or number of responses? (i.e. should the bars total the same length?)
  • If percentages, should the denominator include invalid and/or N/A responses?

I have my own views, but I am looking for other people's ideas.

$\endgroup$

3 Answers 3

33
$\begingroup$

I like the centered count view. This particular version removes the neutral answers (effectively treating neutral and n/a as the same) to show only the amount of agree/disagree opinions. The 0 point is where red and blue meet. The count axis is clipped out.

alt text

For comparison, here are the same five responses as stacked percentages, showing both neutral (gray) and no answer (white).

alt text

Update: Paper suggesting a similar method: Plotting Likert and Other Rating Scales (PDF)

$\endgroup$
8
  • 2
    $\begingroup$ (+1) Interesting! Which software do you use? Just a remark: There's no indication about absolute values for % or counts, so this seems to allow only a relative interpretation. $\endgroup$
    – chl
    Commented Oct 25, 2010 at 17:45
  • $\begingroup$ Sorry, I didn't read your last sentence (the x-axis is invisible). I'll try another remark: Any chance to get the NA counts visible in the centered view (i.e. distinguish them from neutral)? $\endgroup$
    – chl
    Commented Oct 25, 2010 at 18:11
  • 1
    $\begingroup$ @chl Thanks. I use JMP, which I get paid to work on. The first one is a stacked bar chart with positive and negative values, which should be possible in lots of tools. NA counts could be done different ways (at one end, split over both ends, in the middle, separate column) and none seems obviously better for most situations. $\endgroup$
    – xan
    Commented Oct 25, 2010 at 23:55
  • 2
    $\begingroup$ Just wanted to add for the R users that these kind of plots are implemented in the package HH. To give you an impression, you may try likert(t(apply(data, 2, table))). $\endgroup$ Commented Sep 2, 2013 at 12:37
  • 1
    $\begingroup$ I think the reference is "B Robbins, Naomi; M Heiberger, Richard (2011). "Plotting Likert and Other Rating Scales". JSM 2011: 1058–1066." $\endgroup$ Commented Dec 5, 2017 at 5:52
26
$\begingroup$

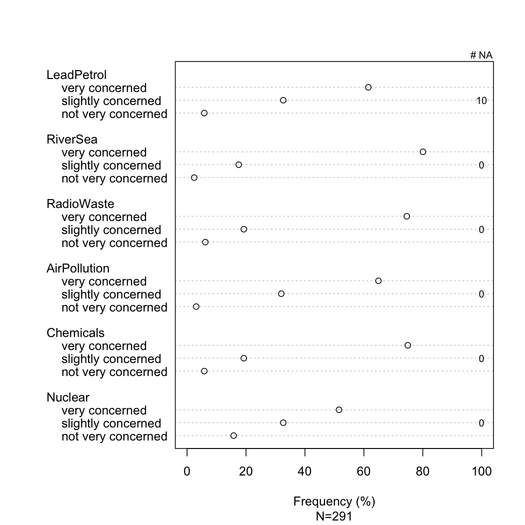
Stacked barcharts are generally well understood by non-statisticians, provided they are gently introduced. It is useful to scale them on a common metric (e.g. 0-100%), with a gradual color for each category if these are ordinal item (e.g. Likert). I prefer dotchart (Cleveland dot plot), when there are not too many items and no more than 3-5 responses categories. But it is really a matter of visual clarity. I generally provide % as it is a standardized measure, and only report both % and counts with non-stacked barchart. Here is an example of what I mean:

data(Environment, package="ltm")
Environment[sample(1:nrow(Environment), 10),1] <- NA
na.count <- apply(Environment, 2, function(x) sum(is.na(x)))
tab <- apply(Environment, 2, table)/
       apply(apply(Environment, 2, table), 2, sum)*100
dotchart(tab, xlim=c(0,100), xlab="Frequency (%)", 
         sub=paste("N", nrow(Environment), sep="="))
text(100, c(2,7,12,17,22,27), rev(na.count), cex=.8)
mtext("# NA", side=3, line=0, at=100, cex=.8)
alt text

Better rendering could be achieved with lattice or ggplot2. All items have the same response categories in this particular example, but in more general case we might expect different ones, so that showing all of them would not seem redundant as is the case here. It would be possible, however, to give the same color to each response category so as to facilitate reading.

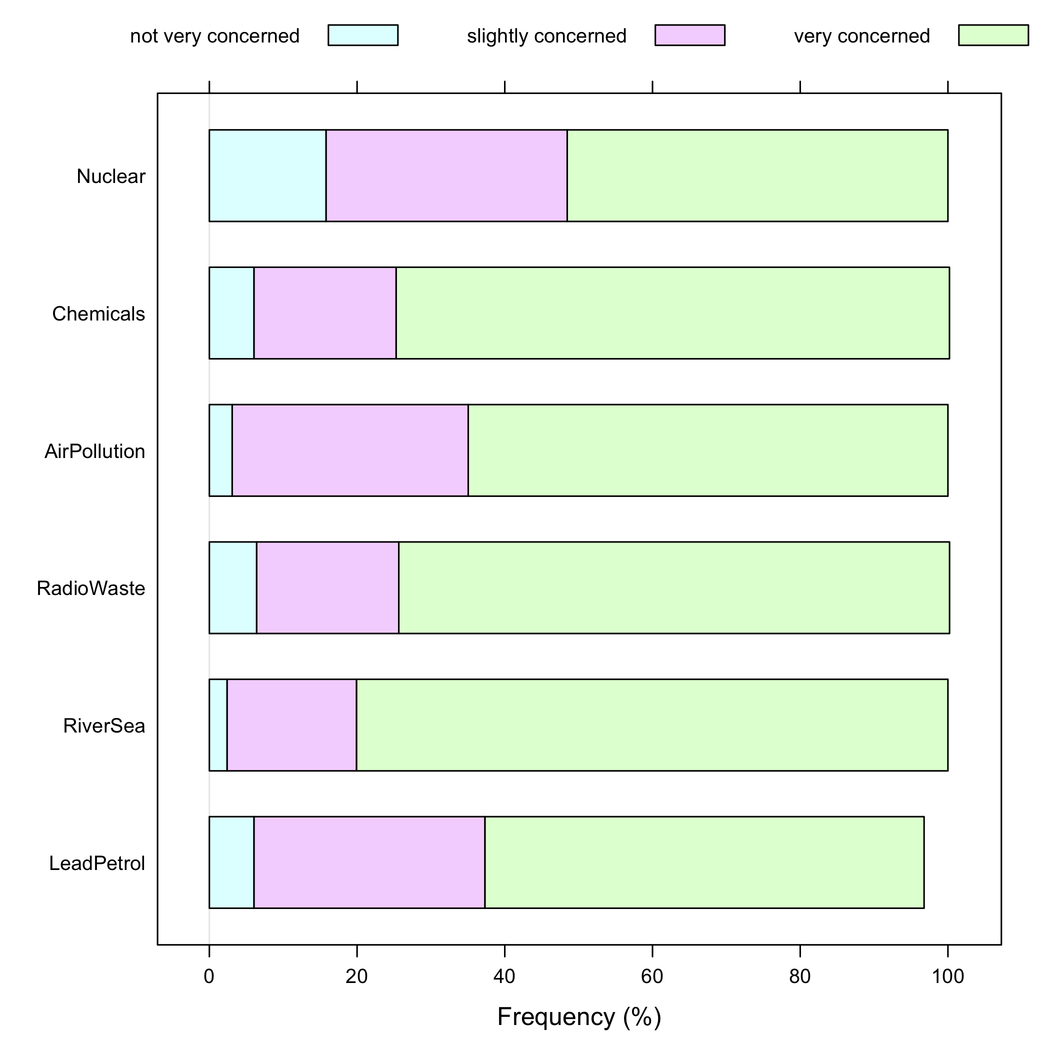
But I would say stacked barcharts are better when all items have the same response category, as they help to appreciate the frequency of one response modality across items:
alt text

I can also think of some kind of heatmap, which is useful if there are many items with similar response category. alt text
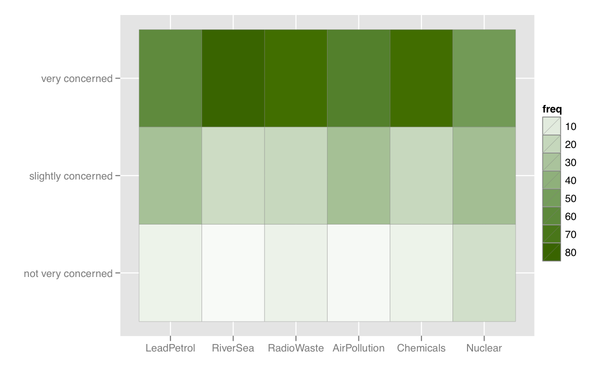
Missing responses (esp. when non negligible or localized on specific item/question) should be reported, ideally for each item. Generally, % of responses for each category are computed without NA. This is what is usually done in survey or psychometrics (we speak of "expressed or observed responses").

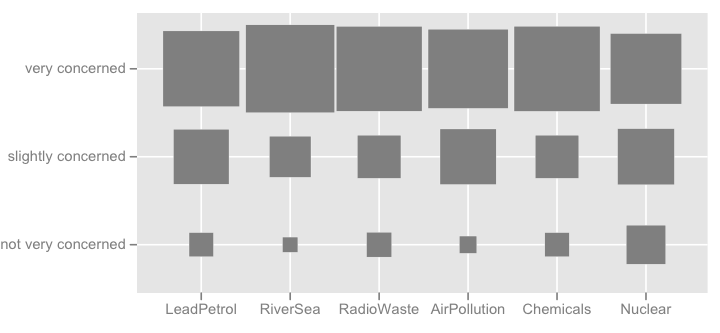
P.S. I can think of more fancy things like the picture shown below (the first one was made by hand, the second is from ggplot2, ggfluctuation(as.table(tab))), but I don't think it convey as accurate information as dotplot or barchart since surface variations are difficult to appreciate. alt text
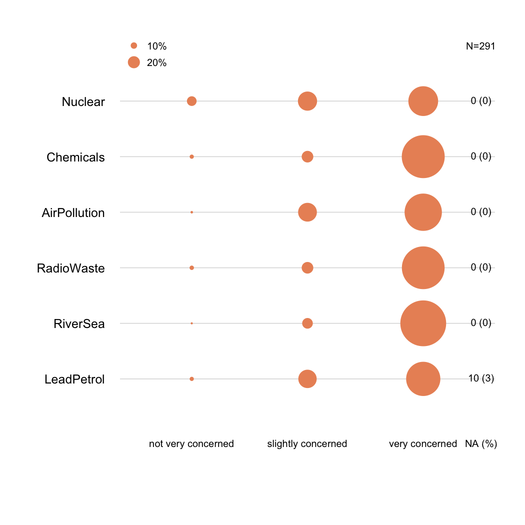
alt text

$\endgroup$
1
  • 2
    $\begingroup$ BTW, A question about Graphing Likert scale responses just came across Andrew Gelman's weblog yesterday :) j.mp/aBm8mZ $\endgroup$
    – chl
    Commented Oct 24, 2010 at 8:46
15
$\begingroup$

I think chl's answer is great.

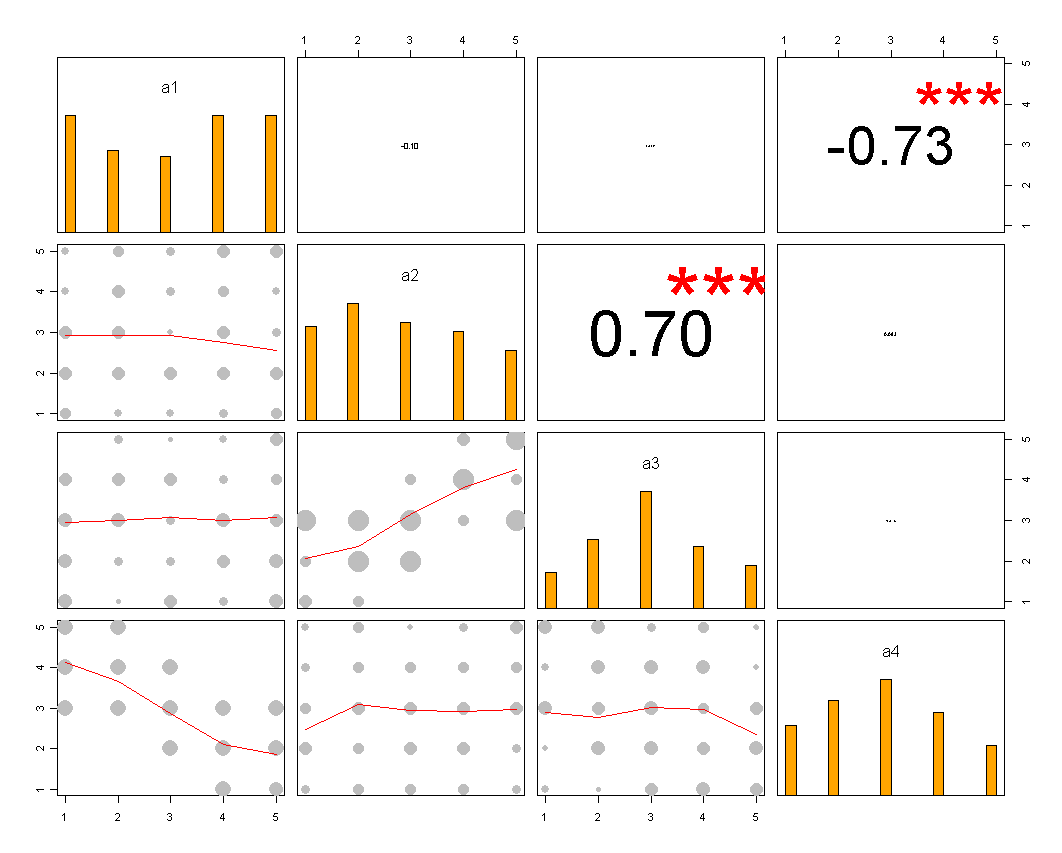
One thing I might add, is for the case you'd want to compare the correlation between the items. For that you can use something like a Correlation scatter-plot matrix for ordered-categorical data

alt text

(That code still needs some tweaking - but it gives the general idea...)

$\endgroup$
2
  • 3
    $\begingroup$ (+1) This remind me of the pairs.panels function in the psych package by W Revelle. $\endgroup$
    – chl
    Commented Oct 23, 2010 at 20:03
  • $\begingroup$ Interesting. I did come across that code, but never knew it also existed in the psych package. I am sure it inspired me in someway when I wrote that post (I should add this to the credits on the post...) $\endgroup$
    – Tal Galili
    Commented Oct 23, 2010 at 22:11

Your Answer

By clicking “Post Your Answer”, you agree to our terms of service and acknowledge you have read our privacy policy.