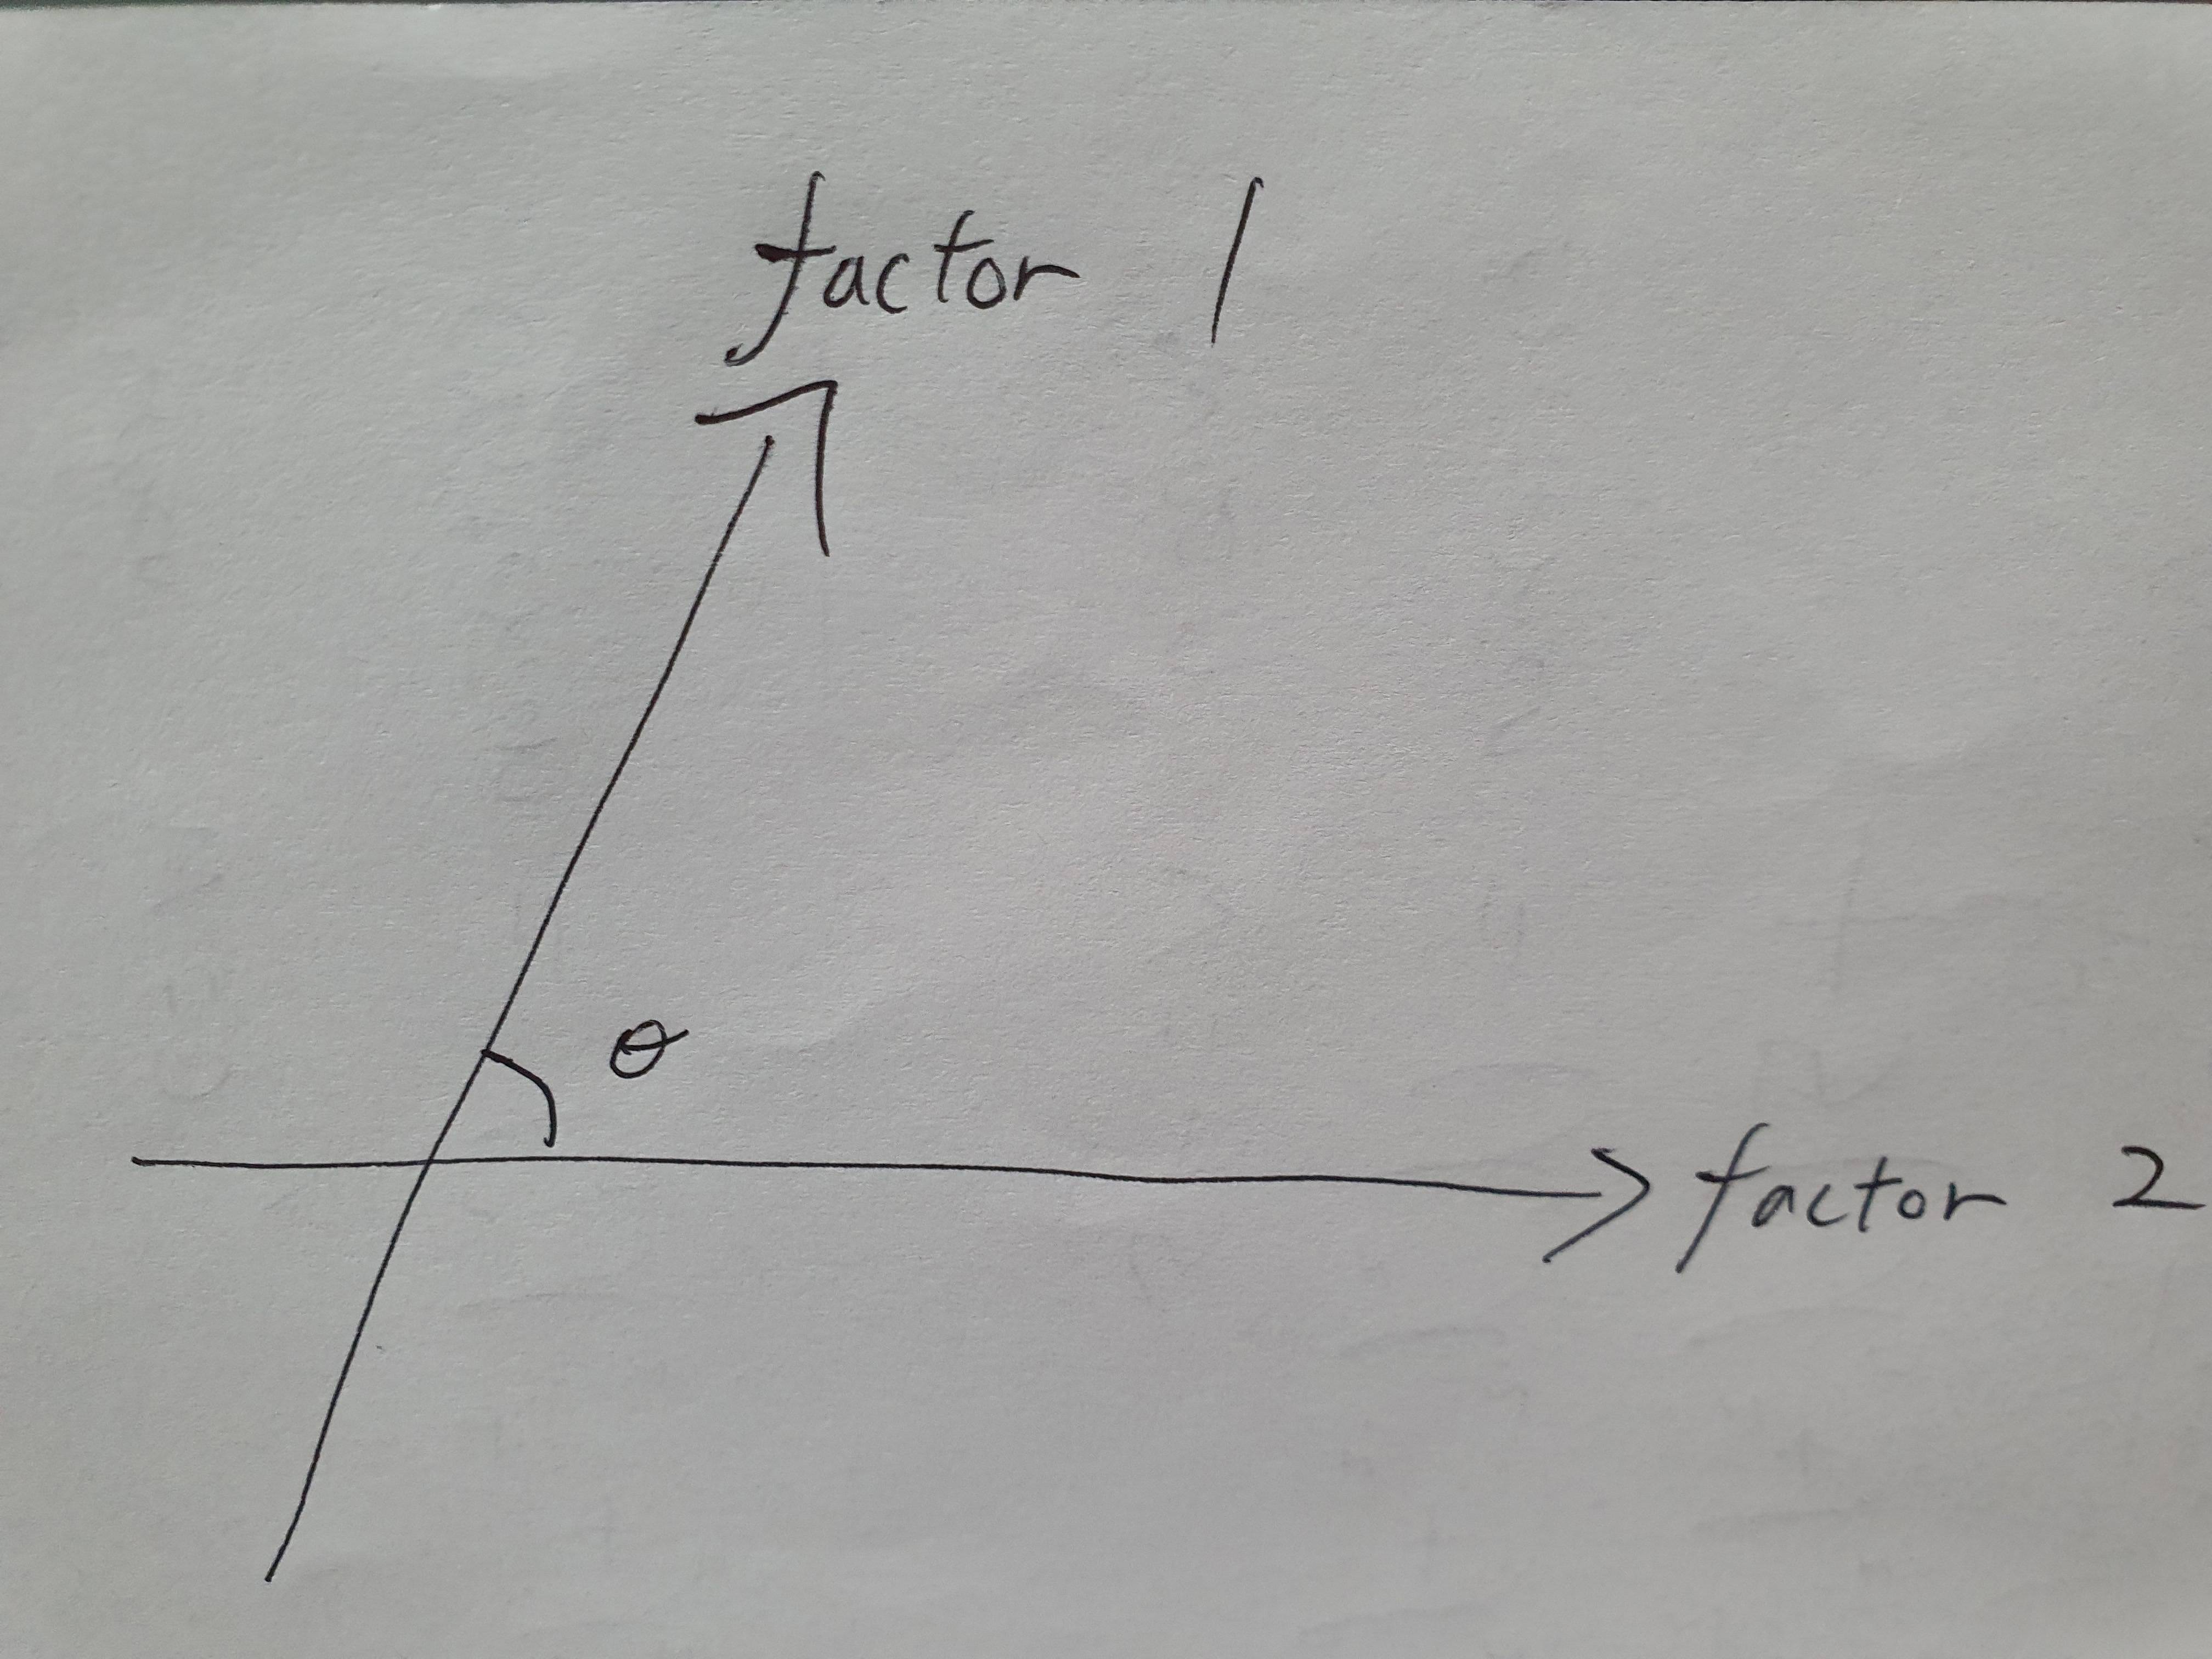
There is a least squares explanation of this.
Let $y$ be one factor (it doesn't matter which) and $x$ be the other. Ordinary least squares regression of $y$ against $x$ (without an intercept!) gives the slope estimate
$$\hat\beta = \frac{y \cdot x}{|x|^2}$$
where $y\cdot x$ is the usual dot product (equal to the matrix product $y^\prime x$ if you like) and $|x|^2 = x\cdot x$ is the squared length of $x$ (assumed to be nonzero).
Thus, the least squares fit is
$$\hat y = \hat\beta x = \left(\frac{y \cdot x}{|x|^2}\right)x.$$
The vectors $y$ and $\hat y,$ along with their common origin, form a triangle. This is a right triangle with hypotenuse subtended by $y.$ Its right angle is at $\hat y.$ One way to tell is to use the fact that right angles are formed only between two orthogonal vectors: that is, their dot product is zero. So we compute the dot product of the two legs $y - \hat y$ (aka the residual) and $x:$
$$ (y - \hat y) \cdot x = y \cdot x - \left(\frac{y \cdot x}{|x|^2}\right)x \cdot x = y\cdot x - \left(\frac{y \cdot x}{|x|^2}\right)|x|^2 = y\cdot x - y\cdot x = 0.$$
(These are called the Normal Equations.)
The most elementary definition of the cosine of the angle between $x$ and $y$ is the ratio of the length of the leg $\hat y$ to the length of the hypotenuse $y:$
$$\cos \theta_{xy} = \frac{|\hat y|}{|y|} = \frac{\bigg|\frac{y \cdot x}{|x|^2}\bigg|\,|x|}{|y|} = \frac{|y\cdot x|}{|x||y|} = \frac{|y\cdot x| / n}{\sqrt{\left(\frac{|x|^2}{n}\frac{|y|^2}{n}\right)}} = \big|\rho(x,y)\big|,$$
the absolute value of the correlation coefficient, assuming $y$ and $x$ have been centered (that is, the components of each one sum to zero). $n$ is the common length of the vectors.
This is actually the unsigned version; by removing the absolute value around $y\cdot x$ we obtain its generalization to signed angles.
Most of the expressions appearing here have standard names in statistics. Here's a brief translation table. It continues to assume $x$ and $y$ are centered.
$$\begin{array}{ll}
\text{Expression} & \text{Name} \\ \hline
y & \text{Response or Dependent variable} \\
x & \text{Explanatory or Independent variable}\\
x\cdot (y - x\hat\beta)= 0 & \text{Normal equations for }\hat\beta\\
\hat y & \text{Fitted or predicted value}\\
y - \hat y & \text{Residual}\\
\hat \beta & \text{Estimated coefficient (slope)}\\
y\cdot x\,/\,n& \text{Covariance}\\
|y|^2\,/\,{n},\ |x|^2\,/\,n & \text{Variances}\\
|\hat y|^2\,/\,|y|^2& R^2,\text{ the coefficient of determination}\\
|\hat y|\,/\,|y| & |\rho|,\text{ the absolute Pearson correlation; also, the size of the cosine}\\
y\cdot x\,/\,(|y||x|) & \text{Correlation coefficient }\rho\\
\arccos\left(y\cdot x\,/\,(|y||x|)\right) & \text{(Signed) angle }\theta_{xy}\\
\hline
\end{array}$$

