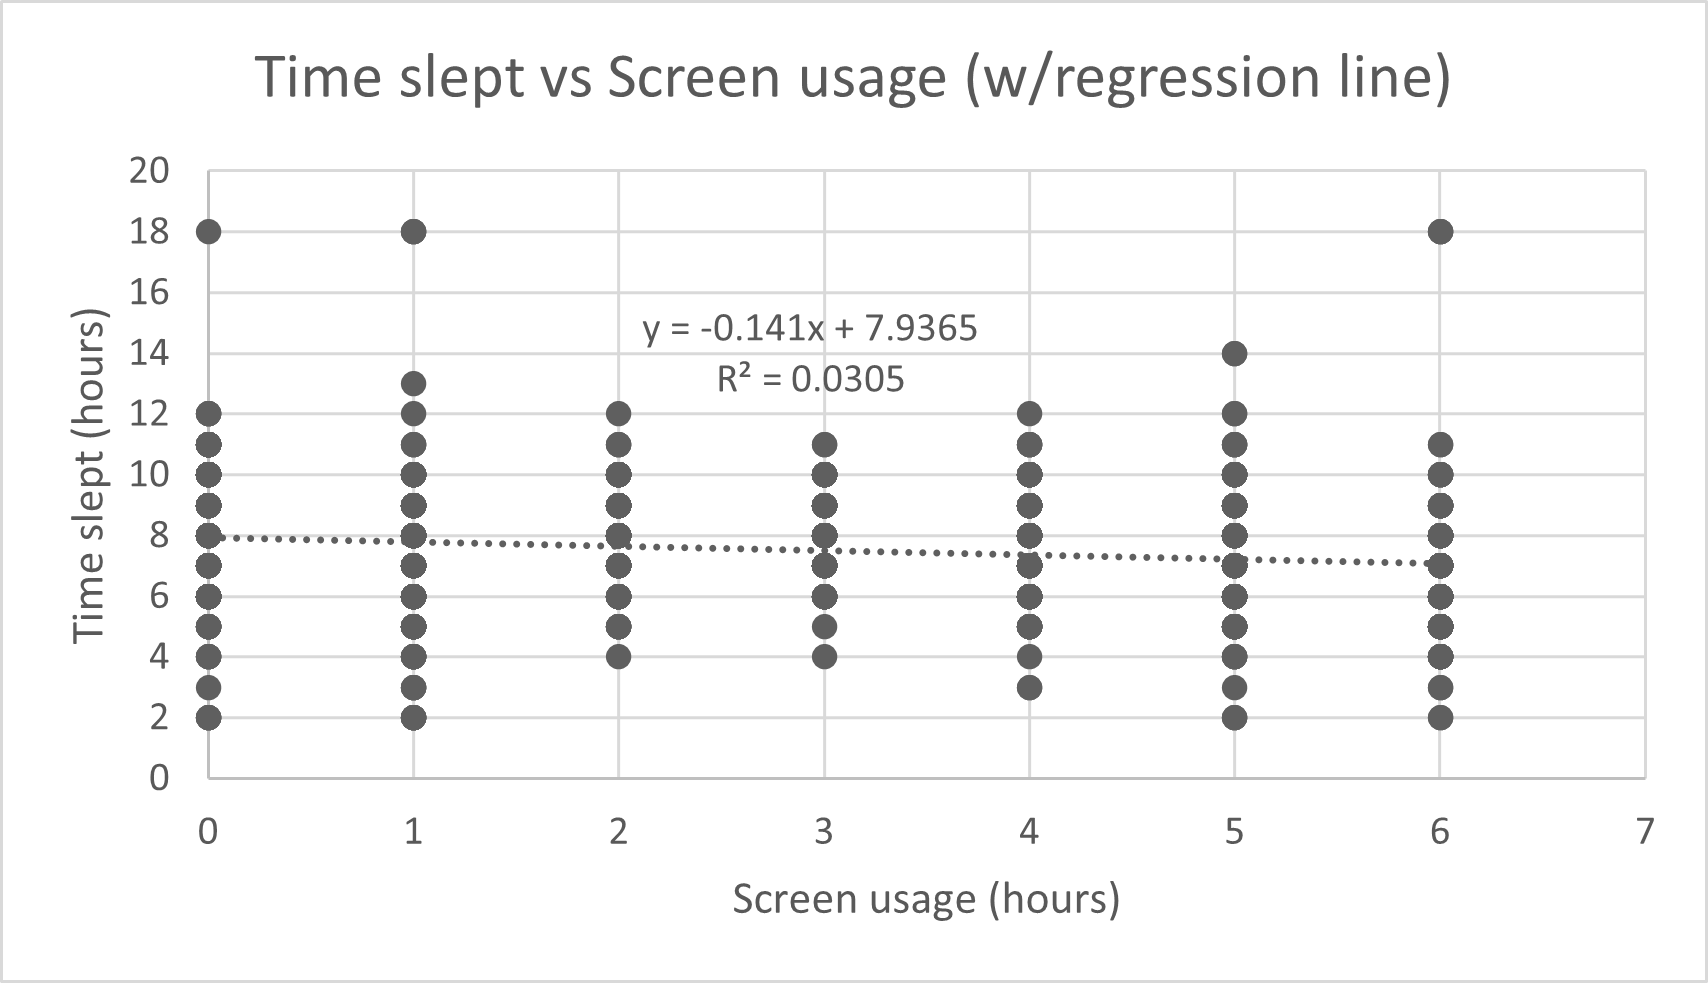
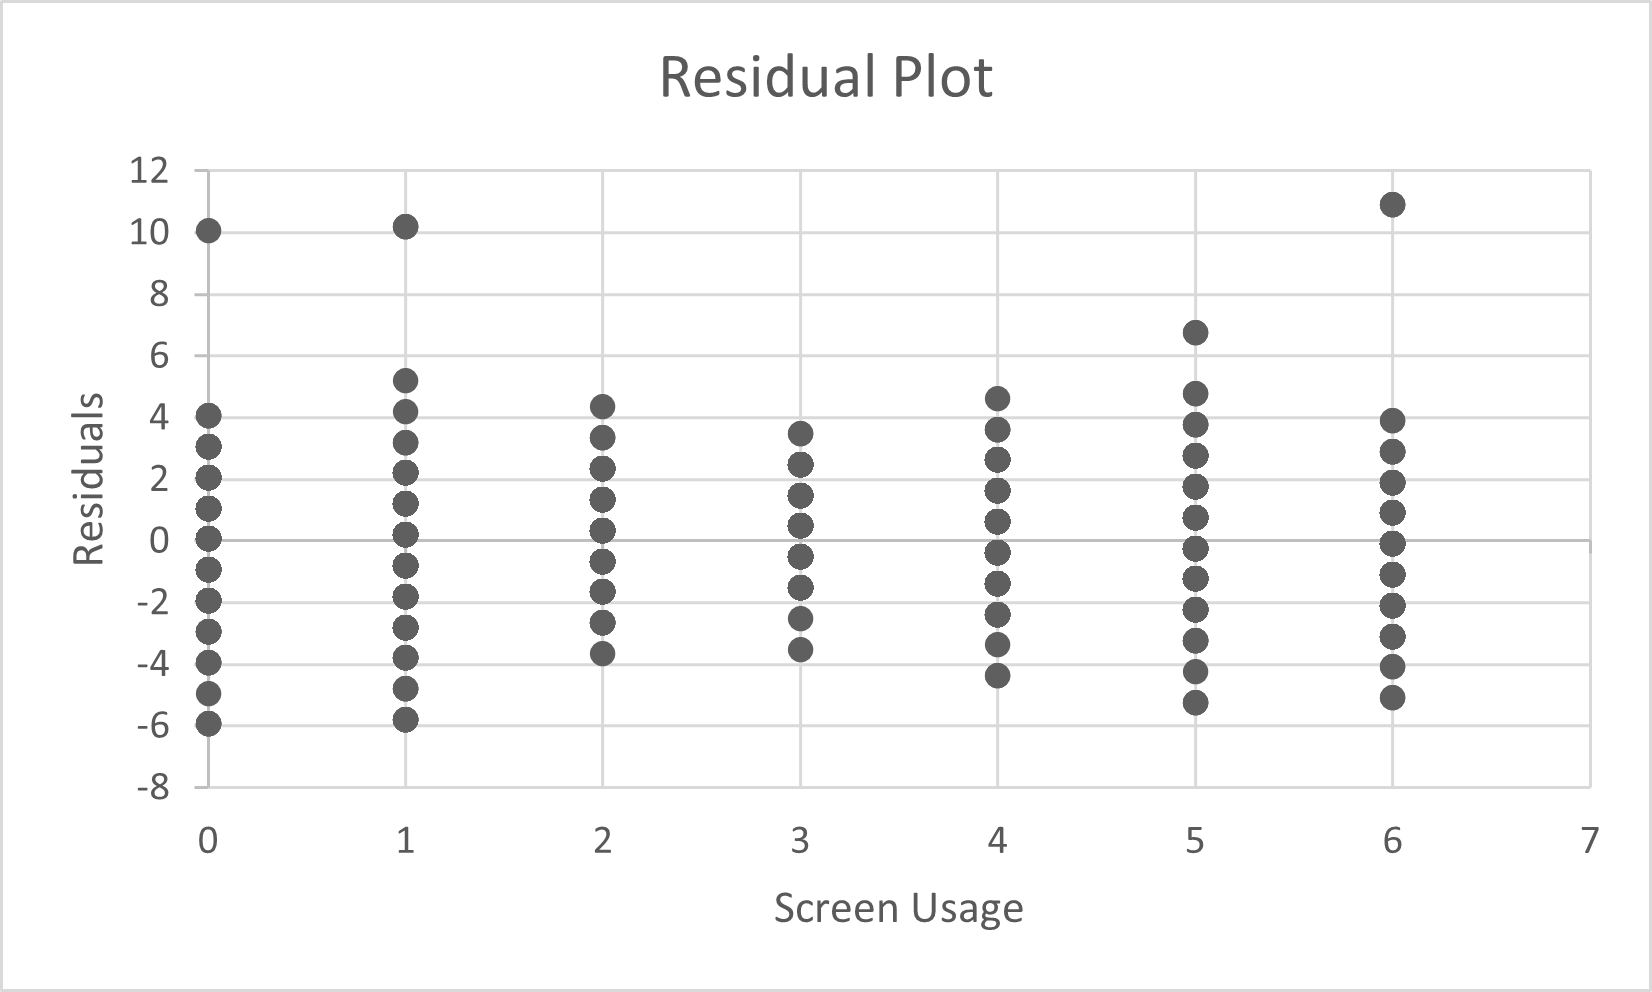
I am investigating the relationship between device usage and screen time for my math assignment (my last ever high school math assignment, yay!), but after creating the residual plot, I realised it looked basically identical to my scatterplot. What does this mean in terms of whether the linear equation is appropriate for a relation between the variables? Also why is this happening? Here are the plots:
-
$\begingroup$ You found $\hat y = -0.141x+7.9365$. Subtracting this from the observed $y$, this moved the points from the scatterplot to the residual plot down by about $8$ although then up by a little bit on the right. And that is precisely what you see. Another issue is that with integer observations, most of the points in your plot overlap so you cannot see the concentration of the distribution. $\endgroup$– HenryCommented Nov 17, 2023 at 9:44
1 Answer
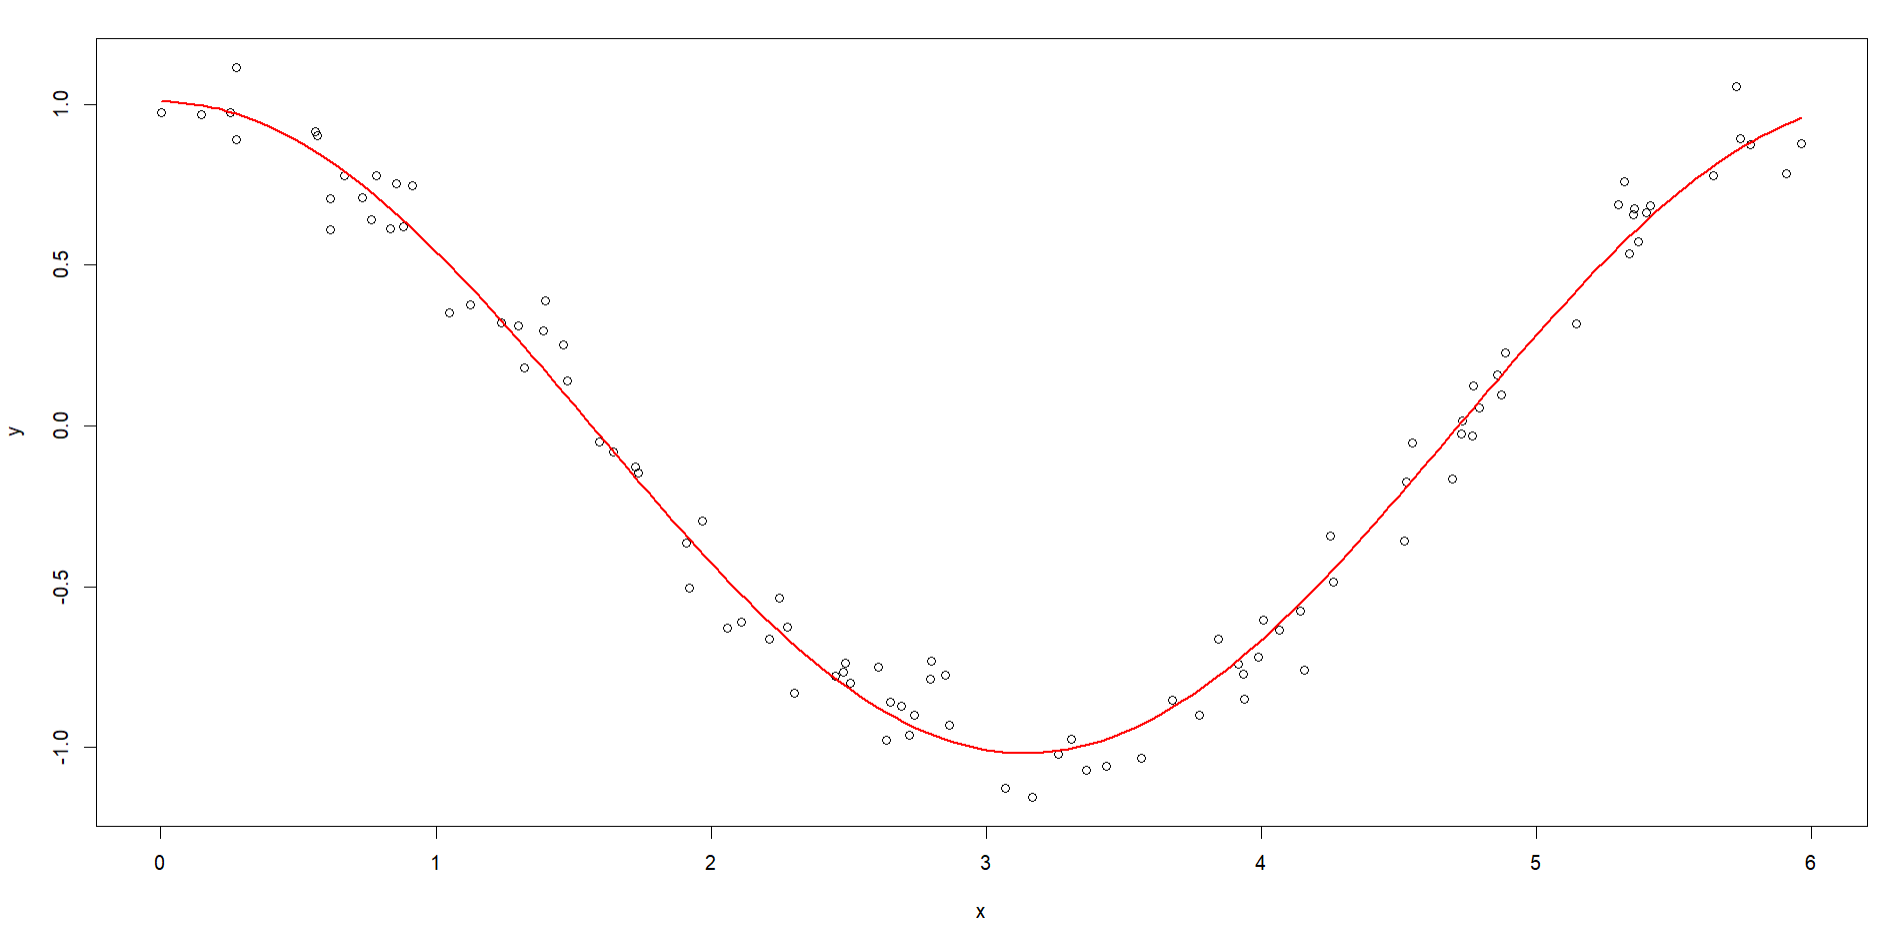
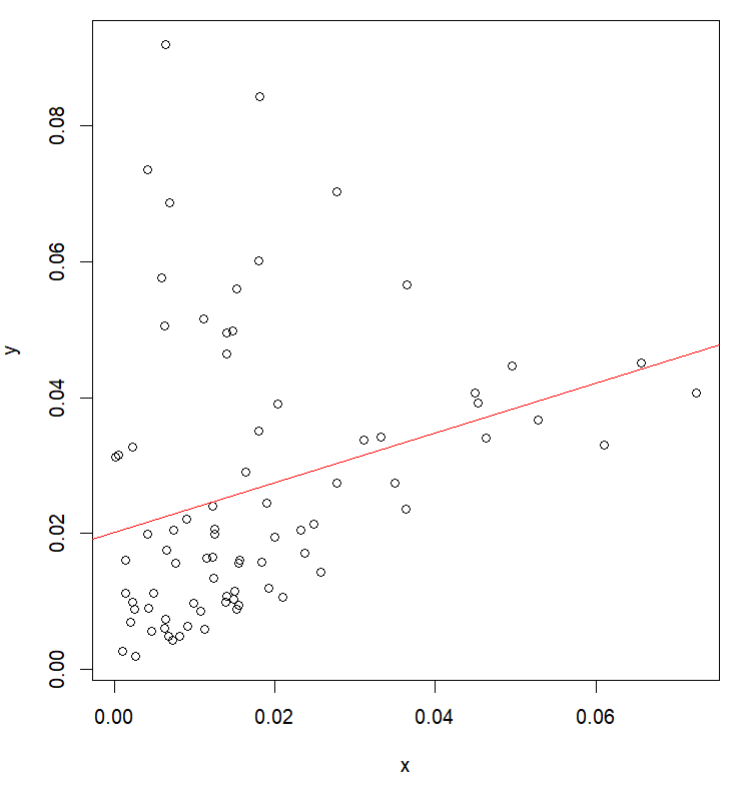
Your scatterplot and residual plot do not need to look like each other, though often they will display similar patterns based on how the regression is fit. A good example is a well-fit nonlinear bivariate relationship that exhibits randomly distributed residuals. Here I have fit a nonlinear regression, with the regression line fitted to the raw data:
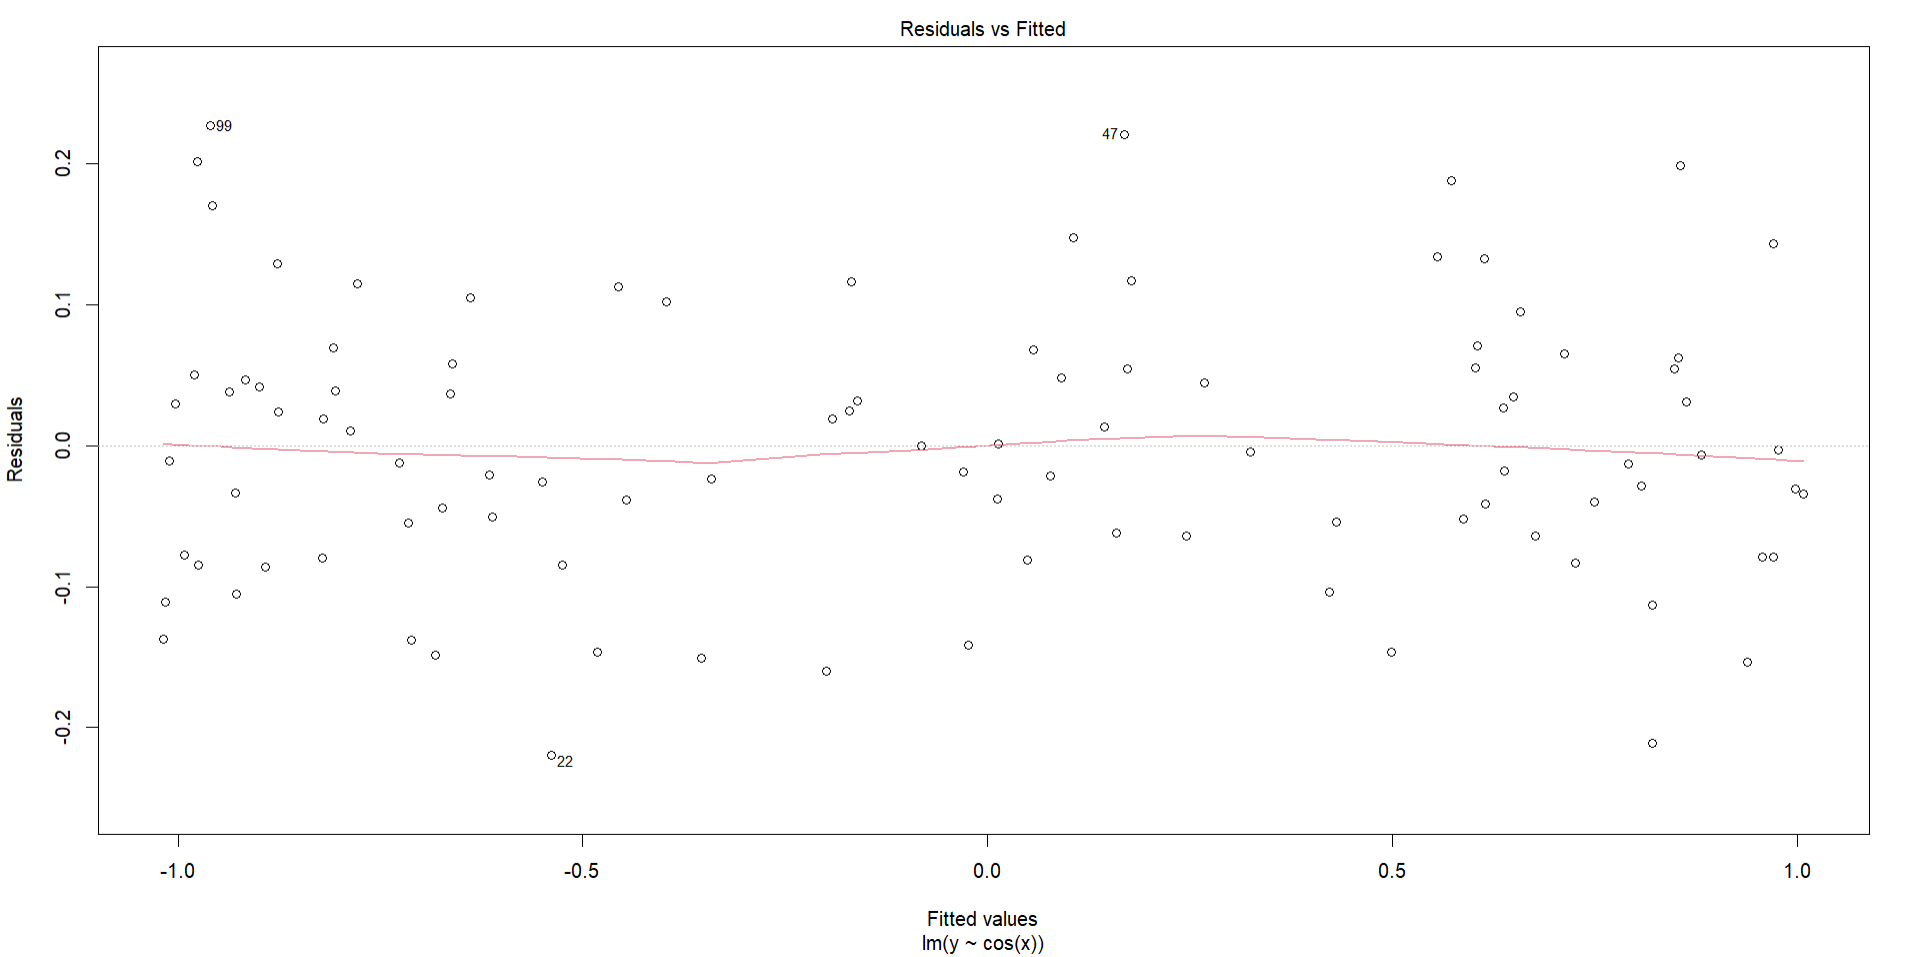
The residual plot looks like this, which doesn't resemble the original data at all:
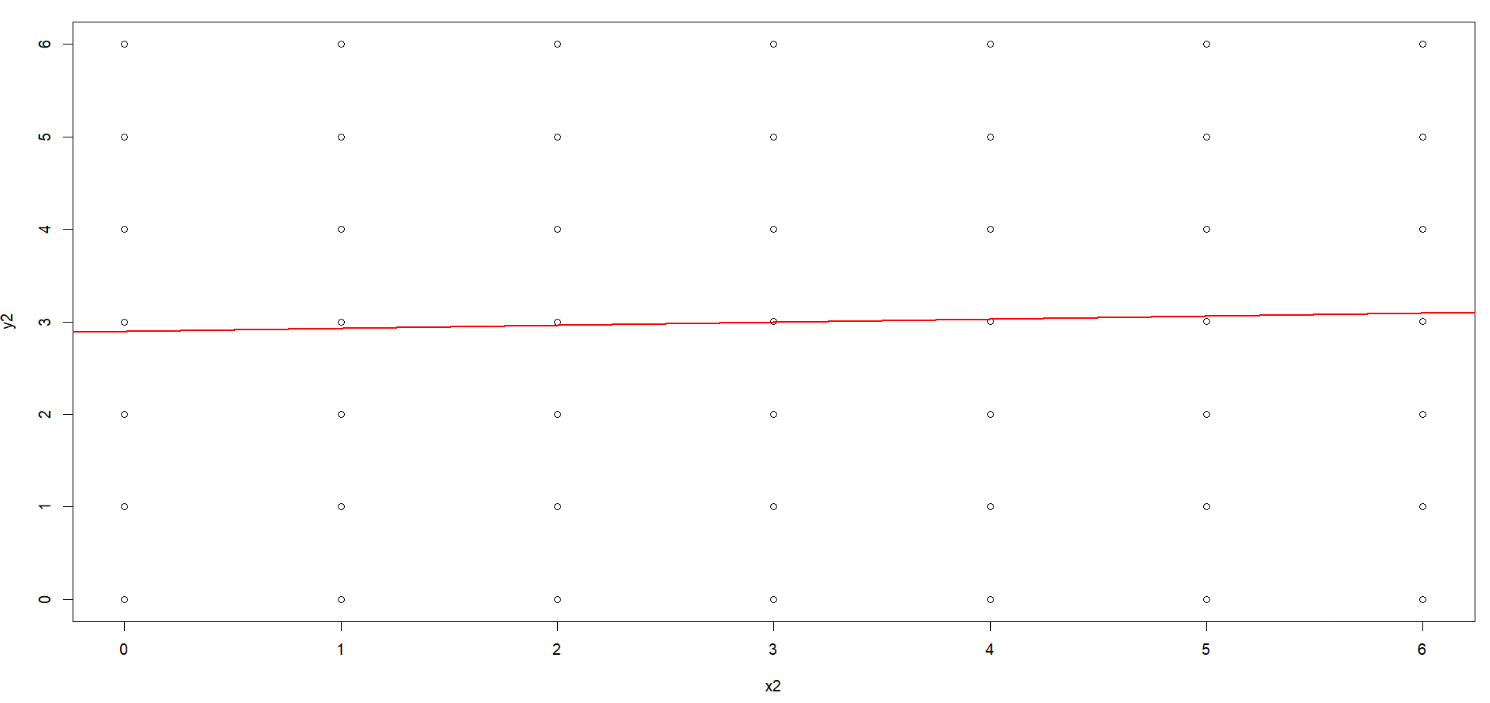
As far as what that means for your regression...your data looks very discrete and doesn't have a clear relationship between the variables (hence the low $R^2$). It has an almost symmetric distribution across the center of the plot where the regression line is being fit (save for some outlier points). And thus the residuals also have a symmetric distribution because there isn't any strong variation in values on either side of the regression line. Therefore it makes sense you have this kind of plot. As an extreme example, here is another simulated set of data which is also discrete and symmetrically distributed:
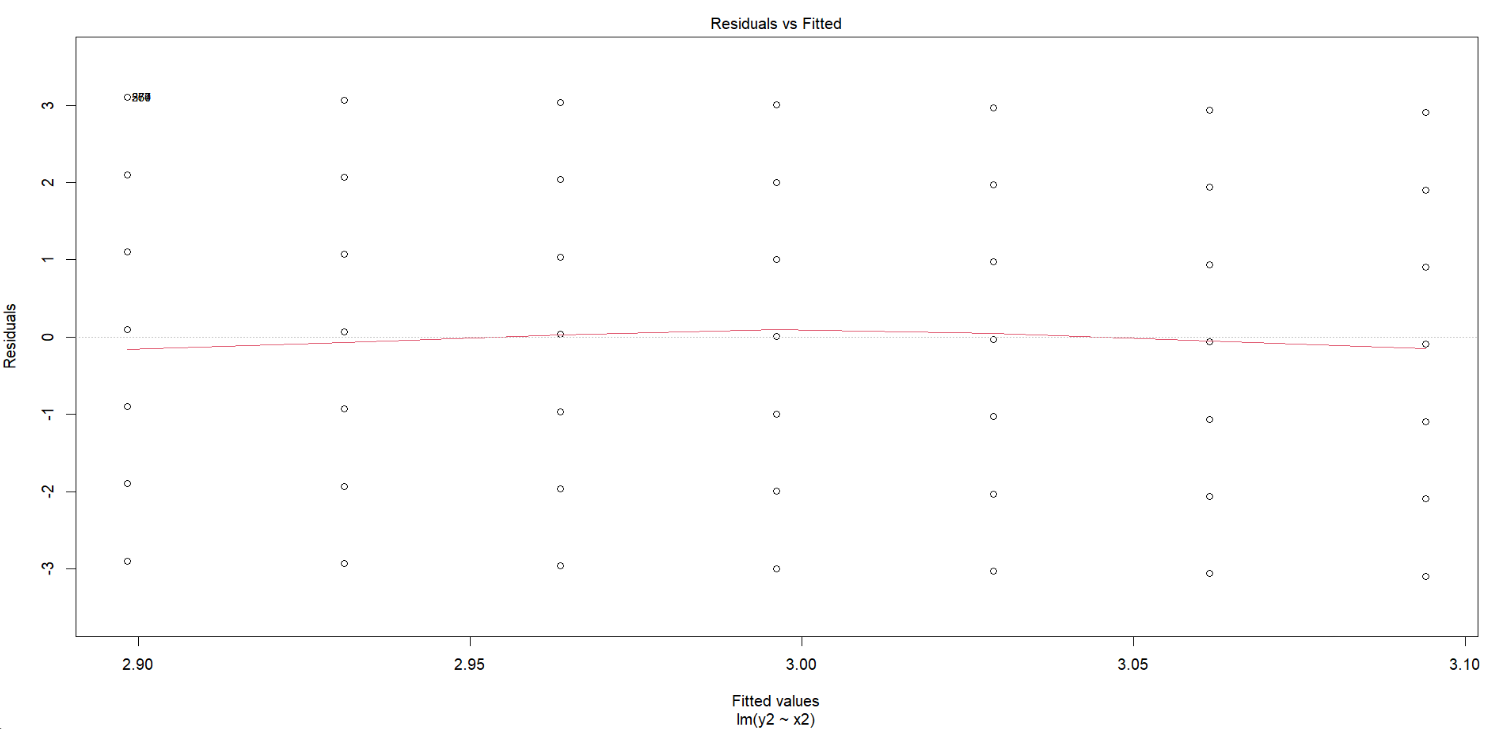
Plotting the residuals, we get an almost identical plot:
Note that for discrete data like this you may want to consider some kind of non-Gaussian error term for modeling the regression, but given this is for high school math I can't imagine that is what the teacher is looking for.
Edit
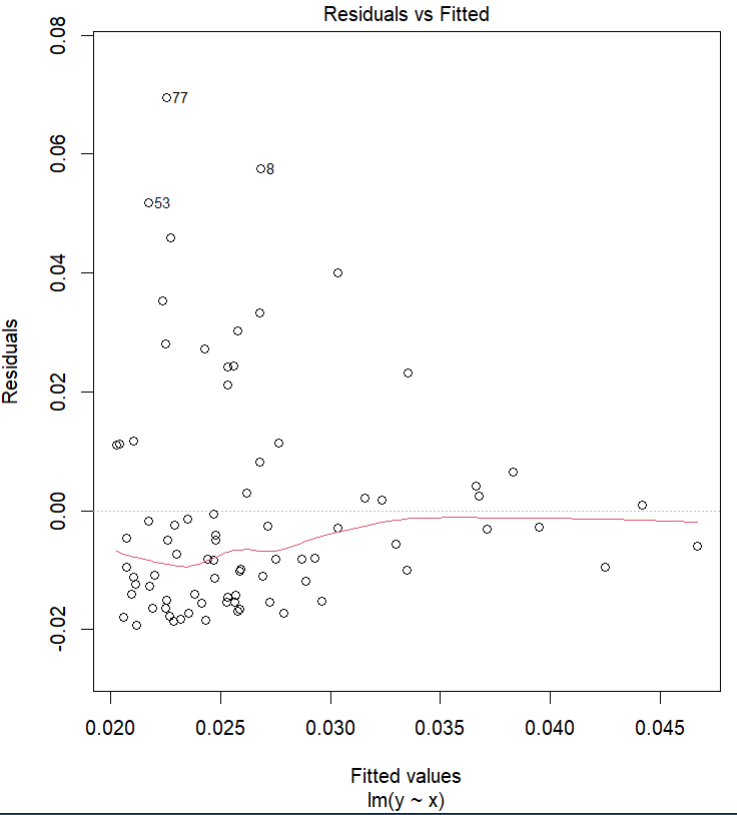
Per the comments, let me add some clarification. There is a linear relationship in your data, it just happens to be very weak (basically no relationship if we are being honest). A linear model is perfectly fine here in any case. The residual plot should also have a linear relationship if it is correctly specified (though the severity of that will determine if its important to care about. As an example of mis-specification, here is a model with some unequal variance, which becomes more dispersed with higher values of $x$ and $y$. We can clearly see issues with the regression fitting here, as it does a terrible job of predicting points where $x$ is low and $y$ is high:
If we now plot the residual plot with a LOESS line (the red line in my residual plots), we can see how the residuals are "weighted". We can now see a pattern, as the data clumps in one area and fans out in a way similar to our raw data, which leads to the very curvy LOESS line in red. So this regression is clearly not specified well, whereas yours doesn't have any more issue.
-
$\begingroup$ Thanks! The only thing that still confuses me a little is that when the residuals are randomly scattered, like they mostly are in my residual plot, doesn't that indicate that the linear model approximates the data points well, and therefore a linear model is appropriate? And wouldn't that suggest that a linear model is appropriate for my data, even though we can see that it seems completely random with very little correlation? $\endgroup$– LucaCommented Nov 17, 2023 at 8:01
-
$\begingroup$ You are correct. Generally speaking, you want randomly distributed residuals (aka random noise) because patterns in the data can mean you have not modeled out things that may be important or potentially biasing your data. For example, fitting the same nonlinear data I had above with a typical OLS line would result in a clear curve pattern in the residuals, indicating that I have incorrectly modeled the data, and should instead fit a nonlinear version. $\endgroup$ Commented Nov 17, 2023 at 8:08
-
$\begingroup$ So when commenting on whether a linear model is appropriate or not, what sort of thing would I say? Sorry, I'm still a little confused, as I wouldn't have thought that there is any linear relationship between the variables in my scatterplot as it looks very random, yet the residual plot says otherwise. $\endgroup$– LucaCommented Nov 17, 2023 at 8:18
-
1$\begingroup$ See my edit for clarification. It probably helps to see wonky residuals. $\endgroup$ Commented Nov 17, 2023 at 8:32
-
1$\begingroup$ Awesome I understand now. Thanks for all the help. $\endgroup$– LucaCommented Nov 17, 2023 at 8:43

