5
$\begingroup$

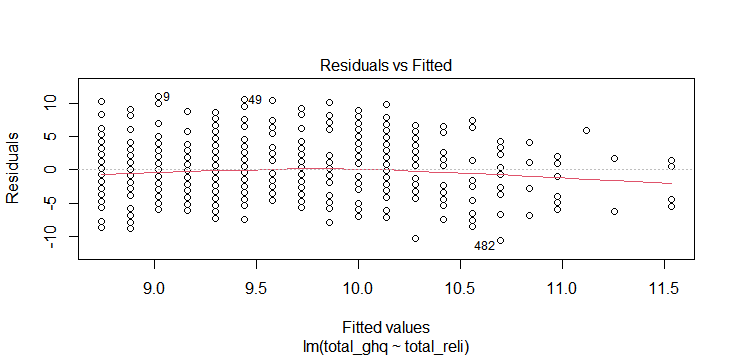
I tried to run a simple linear regression in R, and when I check for the linearity, my "Residuals vs Fitted" graph is like this:

enter image description here

Are the points randomly scattered? Or this showing a pattern because it is all aligned together vertically? *The variables reli and ghq are suppose to be continuous, what I did, for example as ghq, I just summed up the ghq item 1 to 12 into total_ghq, and I did the same thing to total_reli scores. Example: for participant number 1, reli1=3,reli2=3,reli3=1,reli4=2,reli5=2 total_reli=11

$\endgroup$
3
  • $\begingroup$ What distinct values occur for your two variables? $\endgroup$
    – Nick Cox
    Commented Jan 8 at 16:19
  • 1
    $\begingroup$ Both variables appear to be discrete. This can lead to overplotting (and it seems like it may have impacted your plot). That will make any patterns harder to discern; there are a variety of potential solutions to this, including jittering or using semi-transparent points (so that darker shades indicate more data). Please edit your question to explain what the variables are and how they're calculated/measured. $\endgroup$
    – Glen_b
    Commented Jan 9 at 7:20
  • $\begingroup$ The variables reli and ghq are suppose to be continuous, what I did, for example as ghq, I just summed up the ghq item 1 to 12 into total_ghq, and I did the same thing to total_reli scores. Example: for participant number 1, reli1=3,reli2=3,reli3=1,reli4=2,reli5=2, total_reli=11 $\endgroup$
    – Reimy Tan
    Commented Jan 9 at 13:46

2 Answers 2

6
$\begingroup$

I don't see any particularly damning patterns in your residuals versus fitted values. Typically you would see some odd patterns like tight clustering in some regions and more dispersion in others, or some kind of nonlinearity issues which end up in curved LOESS lines (the red one shown above). Some examples of odd residuals can be shown here and here.

Yours do not look particularly problematic and so I agree with Peter that they are not an issue. The "striping" you see here is simply because they are likely discrete values so they do not have any "in-between points." The one caveat is that the right region of your residual plot looks less densely populated with values. This isn't inherently a problem, but may merit investigating to see why this is the case.

I will finally note that the aspect ratio of your plot is very wide (aka stretched out). Sometimes this will distort the LOESS line a bit. The pattern would be more clear if you increased the height a little, but I doubt there are any serious issues regardless.

$\endgroup$
5
  • $\begingroup$ thank you for your answers, but my variables reli and ghq are suppose to be continuous, what i did, for example as ghq, I just summed up the ghq item 1 to12 into total_ghq, and i did the same thing to total_reli scores, i have checked in the rstudio, both total_ghq and total_reli are shown as numerical values, what could possibly turn the variables into discrete? $\endgroup$
    – Reimy Tan
    Commented Jan 9 at 3:50
  • $\begingroup$ Sum scores don't automatically make continuous scores, particularly for counts. If your data points have decimals but there are simply a very low range of available values, then the data can also act like discrete data even when it is essentially continuous in other contexts. If for example $x$ is a variable with decimal values but only has the values $[1,1.5,2,2.5]$, then the data will often behave like discrete values due their consequent binning into a very finite number of possible values. Summing them won't automatically cure that, as you can have a finite number of sum scores too. $\endgroup$ Commented Jan 9 at 4:01
  • $\begingroup$ my data points do not contain decimals, so is it summing up the items make the variables turn into discrete? And does it mean is wrong if i run the linear regression? Sorry im really new to statistic, thank you for your patience $\endgroup$
    – Reimy Tan
    Commented Jan 9 at 4:24
  • $\begingroup$ Yes theyre discrete but theres nothing wrong with running discrete values in a regression (though as Peter noted youll need to also check that you meet the assumptions of regression) $\endgroup$ Commented Jan 9 at 4:28
  • $\begingroup$ understood, thank you very much $\endgroup$
    – Reimy Tan
    Commented Jan 9 at 4:53
4
$\begingroup$

This is (almost certainly) due to your having one independent variable (total_reli) and that it takes on only a certain number of values, one for each column. This is not necessarily a problem for OLS regression, and there is not much of a pattern in the plot. Maybe total_reli is a count, or a rounded number or something like that.

Of course, you have to check the other assumptions as well.

$\endgroup$

Your Answer

By clicking “Post Your Answer”, you agree to our terms of service and acknowledge you have read our privacy policy.

Not the answer you're looking for? Browse other questions tagged or ask your own question.