I am doing linear mixed model and would like to check the assumptions using residual plot and QQ plot. Here is my code:
data1.frame <- read.delim("height.txt", fileEncoding="UTF-16")
lmer50      <- lmer(response ~ (1|jumper) + group*gender, data=data1.frame, REML=FALSE,
                    na.action=na.omit)
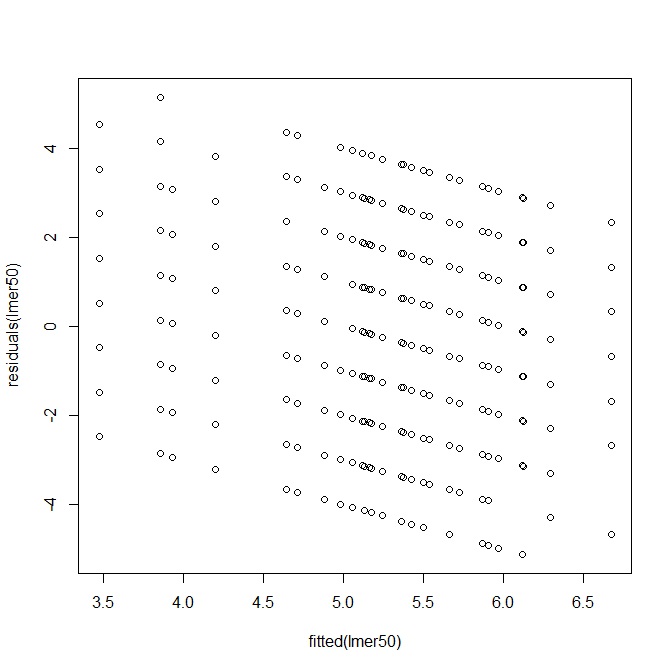
plot(fitted(lmer50), residuals(lmer50))
For the residual plot, here is the output:

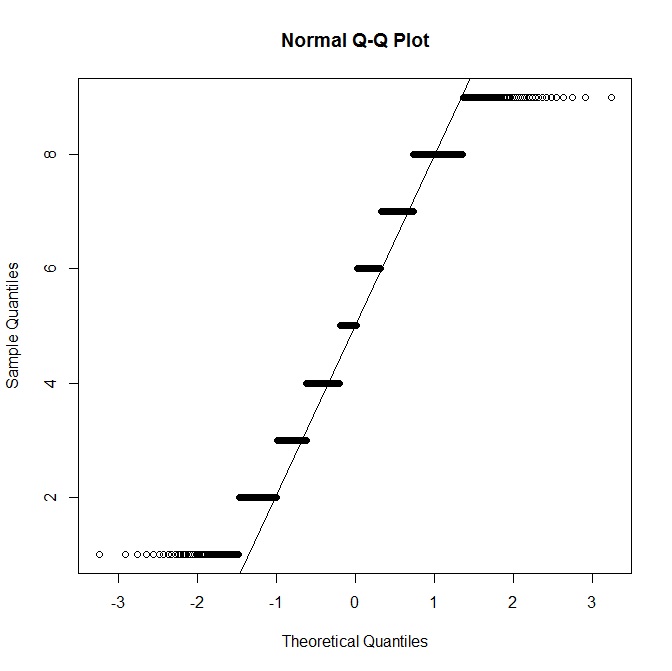
qqnorm(data1.frame$response)
qqline(data1.frame$response)
For the qq plot, this is the output:

Could I ask if both of them look normal? Can I apply linear mixed model in my rating scale data?

