Removed irrelevant tags.
Link
Jeremy Miles
  • 19k
  • 6
  • 46
  • 82
loaded figure; formatted; edited for English; removed thanks
Source Link
gung - Reinstate Monica
  • 147.5k
  • 89
  • 406
  • 717

Hey all you smart people! I am currently doing some research and encountered this issue in one my SEM-analysis. The full SEM model has a very high explained variance (Squared Multiple Correlations) for the explained latent variable.

Here is the full SEM model: http://1drv.ms/1oPm41w
Here is the

http://1drv.ms/1oPm41w

The output is here: http://1drv.ms/1oPlUXG(pdf).

The model fit is not exactly great, hence I wonder what possible explainations thatexplanation there could be for the high explained variance. My current idea is that some of the latent indicators have cross loadingloadings on the indicators, but otherwise I am stumped! Hope someone can offer some clarify for a beginner in SEM-modelling.

Thanks!

Hey all you smart people! I am currently doing some research and encountered this issue in one my SEM-analysis. The full SEM model has a very high explained variance (Squared Multiple Correlations) for the explained latent variable.

Here is the full SEM model: http://1drv.ms/1oPm41w
Here is the output: http://1drv.ms/1oPlUXG

The model fit is not exactly great hence I wonder what possible explainations that could be for the high explained variance. My current idea is that some of the latent indicators have cross loading on the indicators but otherwise I am stumped! Hope someone can offer some clarify for a beginner in SEM-modelling.

Thanks!
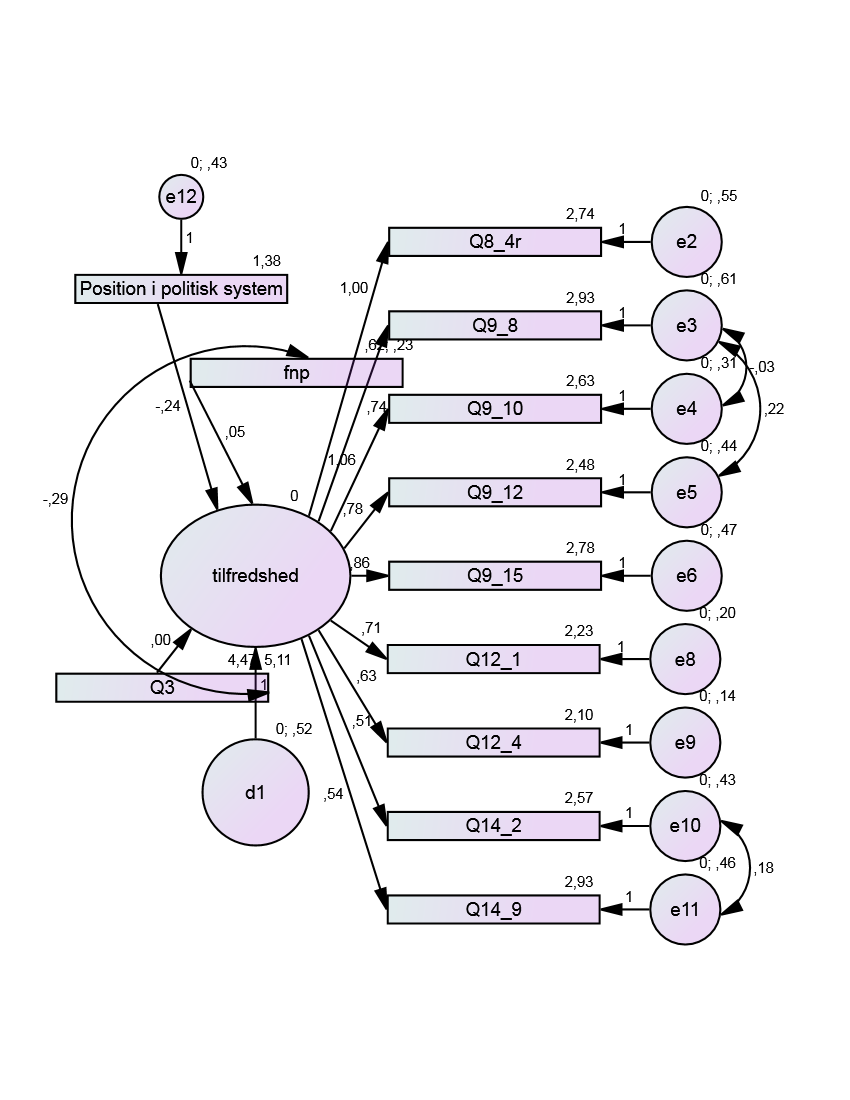
I am currently doing some research and encountered this issue in one my SEM-analysis. The full SEM model has a very high explained variance (Squared Multiple Correlations) for the explained latent variable.

Here is the full SEM model:

http://1drv.ms/1oPm41w

The output is here: (pdf).

The model fit is not exactly great, hence I wonder what possible explanation there could be for the high explained variance. My current idea is that some of the latent indicators have cross loadings on the indicators, but otherwise I am stumped!

Source Link

Possible explanations for high explained variance but poor model fit AMOS

Hey all you smart people! I am currently doing some research and encountered this issue in one my SEM-analysis. The full SEM model has a very high explained variance (Squared Multiple Correlations) for the explained latent variable.

Here is the full SEM model: http://1drv.ms/1oPm41w
Here is the output: http://1drv.ms/1oPlUXG

The model fit is not exactly great hence I wonder what possible explainations that could be for the high explained variance. My current idea is that some of the latent indicators have cross loading on the indicators but otherwise I am stumped! Hope someone can offer some clarify for a beginner in SEM-modelling.

Thanks!