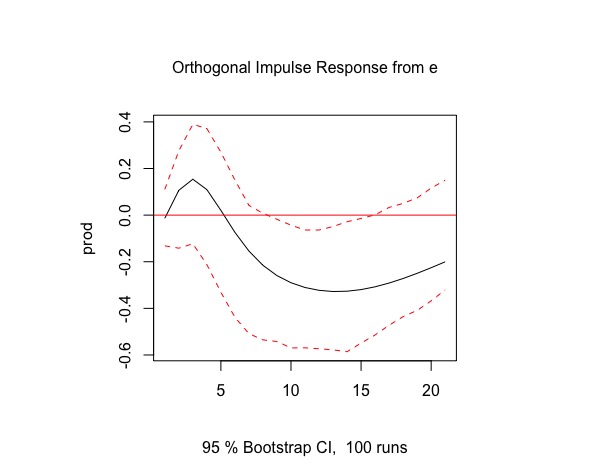
I have a question related to the interpretation of Impulse Response Function (IRF) functions. Assume we do have two time-series that have been both log-transformed and are stationary. When applying a IRF in the vars package, how do we "read" the x and y-axis correctly?
Example:
# Load data and apply VAR
library("vars")
data(Canada)
data <- Canada
data <- data.frame(data[,1:2])
var <- VAR(data, p=3, type = "both")
plot(irf(var, impulse = "e", response = "prod", boot = T, cumulative = FALSE, n.ahead = 20, ci=0.95))
Which interpretation is correct?
- A 1% log-increase of
ecauses a 15% increase ofprodat lag 3? - A 1% increase of
ecauses a 15% log-increase ofprodat lag 3? - Both is wrong, correct is:
Thanks for your help!

