4
$\begingroup$

I have a question related to the interpretation of Impulse Response Function (IRF) functions. Assume we do have two time-series that have been both log-transformed and are stationary. When applying a IRF in the vars package, how do we "read" the x and y-axis correctly?

Example:

# Load data and apply VAR
library("vars")
data(Canada)
data <- Canada
data <- data.frame(data[,1:2])
var <- VAR(data, p=3, type = "both")
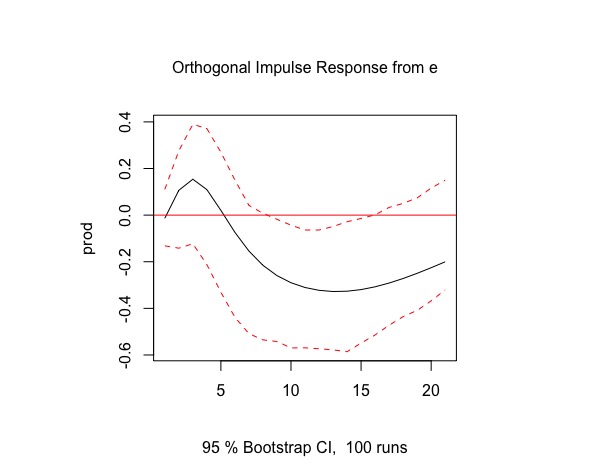
plot(irf(var, impulse = "e", response = "prod", boot = T, cumulative = FALSE, n.ahead = 20, ci=0.95))

irf-example

Which interpretation is correct?

  1. A 1% log-increase of e causes a 15% increase of prod at lag 3?
  2. A 1% increase of e causes a 15% log-increase of prod at lag 3?
  3. Both is wrong, correct is:

Thanks for your help!

$\endgroup$

2 Answers 2

7
+25
$\begingroup$

The VAR(p) model is defined as

$$y_t = \Phi_0 + \Phi_1 y_{t-1} + ... + \Phi_p y_{t-p} + u_t$$

In your case $p=3$ and $y_t \in \mathbb R^2$ with the two variables $y_t =(prod_t,e_t)$. The infinite MA($\infty$) representation is

$$y_{t+h} = \sum_{i=0}^\infty \Psi_i u_{t+h-i}$$

and the impulse response function can be read of from the coefficients

$$\{\Psi_h\}_{ij} = \frac{\partial y_{it +h}}{\partial u_{jt}}$$

How does a shock in the $j$-proces proces at time $t$ affect the $i$-proces at time $t+h$. A 1-unit change in the $u_{jt}$ is an unexpected increase in $y_{jt}$ by 1 full unit. Since both your processes are in logs I would therefore say that

A 1% unexpected increase in e three periods back is a 15% increase in prod today.

$\endgroup$
2
  • $\begingroup$ Thank you. That's roughly what I also had in mind. But please have a bit of patience, I like to wait for a bit more confirmation, or alternative explanations. $\endgroup$
    – RaymondD
    Commented Dec 21, 2018 at 15:25
  • $\begingroup$ A 1 sd. shock in a logarithmized variable does NOT correspond to a 1% shock in the original variable. The 15% is also not quite correct, see my answer below. $\endgroup$ Commented Jan 5, 2023 at 8:20
1
$\begingroup$

Old question, but since it so far has only an incorrect answer, I'll give it a shot:

In general the interpretation of the irf is: How does a 1-standard deviation shock in the impulse affect the response (after different lags). See here

An absolute change in a logarithmized variable corresponds to a relative change in the original variable because of

$$\frac{\exp(x + \Delta x) - \exp(x)}{\exp(x)} = \exp(\Delta x) - 1$$ (the point is that this is independent of $x$).

So in your example, the correct interpretation is that a one standard deviation move in the logarithmized e corresponds to a $\exp(0.15) - 1 \approx 16\% $ move in prod at lag 3.

Or, if you want to express the impuls in non-log terms as well: A $(\exp(\sigma) - 1)\cdot 100\%$ move in the non-logarithmized e corresponds to a $16\%$ move in the non-log. prod, where $\sigma$ is the standard deviation for the logarithmized e.

The pattern here is that absolute moves in log variables correspond to relative moves in non-log-variables.

Around $0$ you approximately have $ \exp(x) = 1 + x $, which is the reason why for small values the interpretation of the prod-axis as relative change in non-log data roughly works, even though it actually shows absolut change in the log-data.

$\endgroup$

Your Answer

By clicking “Post Your Answer”, you agree to our terms of service and acknowledge you have read our privacy policy.

Not the answer you're looking for? Browse other questions tagged or ask your own question.