edited tags
Link
dipetkov
  • 10.7k
  • 2
  • 20
  • 55
added 357 characters in body
Source Link

I'm exploring some manual approaches to understand whether specific changes on a site can be deemed conclusive and statistically significant.

I appreciate that any A/B testing platform has a reporting part of doing this job; however, changes have been implemented without any platform, so my best bet was pulling out data and doing this exercise manually.

The scenario

36 pages, 24 of which have a feature the remaining 12 have not.

Looking at the daily traffic values, traffic rose by +50% on the group where the feature is in. But I need to provide a confidence interval or a statistically significant coefficient for the senior management.

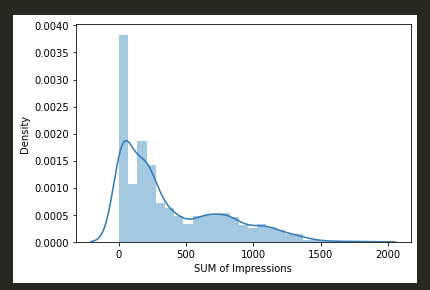
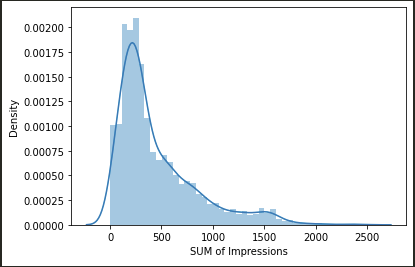
The two groups of data (8760 & 4380 entries respectively) are heteroscedastic (Levene test suggests it) and not normally distributed (after all they are traffic data).

enter image description here

enter image description here

Note: I believe the data are not normally distributed as the bell curve is not properly centered, but I might be wrong in saying so. Still have to gain experience in this field.

The result

When running a Welch's test as below, I get a p-value that is absnormal:

stats.ttest_ind(faq['traffic'], no_faq['traffic'], equal_var=False, axis=0)

Ttest_indResult(statistic=-23.253270956567135, pvalue=1.3551062210749643e-114)

Now, if the H0 is that the page feature does not influence the traffic, the high p-value here confirms me the opposite.

Question

What I'm struggling to understand is the very high p-value that goes beyond the 100% mark. Am I doing something wrong? Should I use a different test? What to calculate a confidence score?

I'm exploring some manual approaches to understand whether specific changes on a site can be deemed conclusive and statistically significant.

I appreciate that any A/B testing platform has a reporting part of doing this job; however, changes have been implemented without any platform, so my best bet was pulling out data and doing this exercise manually.

The scenario

36 pages, 24 of which have a feature the remaining 12 have not.

Looking at the daily traffic values, traffic rose by +50% on the group where the feature is in. But I need to provide a confidence interval or a statistically significant coefficient for the senior management.

The two groups of data (8760 & 4380 entries respectively) are heteroscedastic (Levene test suggests it) and not normally distributed (after all they are traffic data).

The result

When running a Welch's test as below, I get a p-value that is absnormal:

stats.ttest_ind(faq['traffic'], no_faq['traffic'], equal_var=False, axis=0)

Ttest_indResult(statistic=-23.253270956567135, pvalue=1.3551062210749643e-114)

Now, if the H0 is that the page feature does not influence the traffic, the high p-value here confirms me the opposite.

Question

What I'm struggling to understand is the very high p-value that goes beyond the 100% mark. Am I doing something wrong? Should I use a different test? What to calculate a confidence score?
I'm exploring some manual approaches to understand whether specific changes on a site can be deemed conclusive and statistically significant.

I appreciate that any A/B testing platform has a reporting part of doing this job; however, changes have been implemented without any platform, so my best bet was pulling out data and doing this exercise manually.

The scenario

36 pages, 24 of which have a feature the remaining 12 have not.

Looking at the daily traffic values, traffic rose by +50% on the group where the feature is in. But I need to provide a confidence interval or a statistically significant coefficient for the senior management.

The two groups of data (8760 & 4380 entries respectively) are heteroscedastic (Levene test suggests it) and not normally distributed (after all they are traffic data).

enter image description here

enter image description here

Note: I believe the data are not normally distributed as the bell curve is not properly centered, but I might be wrong in saying so. Still have to gain experience in this field.

The result

When running a Welch's test as below, I get a p-value that is absnormal:

stats.ttest_ind(faq['traffic'], no_faq['traffic'], equal_var=False, axis=0)

Ttest_indResult(statistic=-23.253270956567135, pvalue=1.3551062210749643e-114)

Now, if the H0 is that the page feature does not influence the traffic, the high p-value here confirms me the opposite.

Question

What I'm struggling to understand is the very high p-value that goes beyond the 100% mark. Am I doing something wrong? Should I use a different test? What to calculate a confidence score?

edited tags
Link
Robert Long
  • 65.8k
  • 11
  • 133
  • 248
Source Link
Loading