added 187 characters in body
Source Link

Here is the linear mixed model that I am working with:

p3 <- lmer(respTime ~ proc*farFC+(1 | Subject), dtINT)

Proc refers to a factor with 2 levels (adjacent and overlay) farFC refers to a continous variable with 9 levels

The main output is below.

enter image description here

The slope of overlay is = 0.958.

When I change the reference level from adjacent to overlay, the slope of adjacent is -0.958.

Here is the code for how I am changing the reference level:

dtINT <- within(dtINT, proc <- relevel(proc, ref = 2)) 
#1 = ref level is overlay, 2 = ref level is adjacent

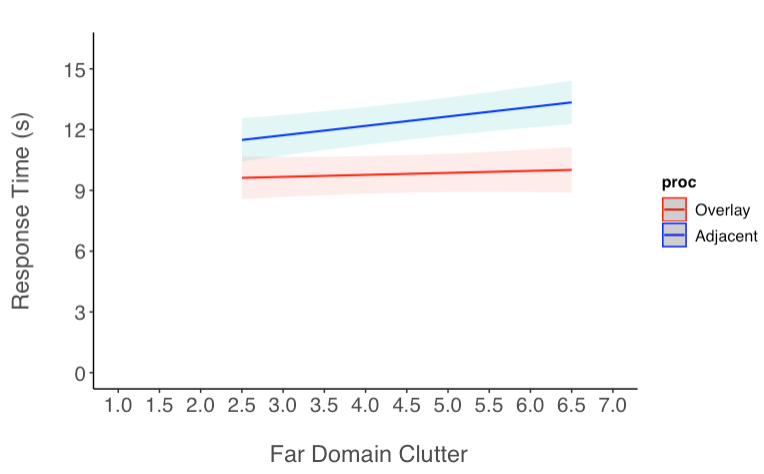
Why are the slopes the same but in opposite directions? Below is a graph, and we can see that the slopes are not the same (lines are not perfectly parallel).

enter image description here

How do I compute the slopes of each of these lines from the model? Said differently, how do I compute the slopes for each level of my IV? How do I tell if each of those slopes are significant?

Here is the linear mixed model that I am working with:

p3 <- lmer(respTime ~ proc*farFC+(1 | Subject), dtINT)

Proc refers to a factor with 2 levels (adjacent and overlay) farFC refers to a continous variable with 9 levels

The main output is below.

enter image description here

The slope of overlay is = 0.958.

When I change the reference level from adjacent to overlay, the slope of adjacent is -0.958.

Why are the slopes the same but in opposite directions? Below is a graph, and we can see that the slopes are not the same (lines are not perfectly parallel).

enter image description here

How do I compute the slopes of each of these lines from the model? Said differently, how do I compute the slopes for each level of my IV? How do I tell if each of those slopes are significant?
Here is the linear mixed model that I am working with:

p3 <- lmer(respTime ~ proc*farFC+(1 | Subject), dtINT)

Proc refers to a factor with 2 levels (adjacent and overlay) farFC refers to a continous variable with 9 levels

The main output is below.

enter image description here

The slope of overlay is = 0.958.

When I change the reference level from adjacent to overlay, the slope of adjacent is -0.958.

Here is the code for how I am changing the reference level:

dtINT <- within(dtINT, proc <- relevel(proc, ref = 2)) 
#1 = ref level is overlay, 2 = ref level is adjacent

Why are the slopes the same but in opposite directions? Below is a graph, and we can see that the slopes are not the same (lines are not perfectly parallel).

enter image description here

How do I compute the slopes of each of these lines from the model? Said differently, how do I compute the slopes for each level of my IV? How do I tell if each of those slopes are significant?

Source Link

Compute slopes for both levels of a factor

Here is the linear mixed model that I am working with:

p3 <- lmer(respTime ~ proc*farFC+(1 | Subject), dtINT)

Proc refers to a factor with 2 levels (adjacent and overlay) farFC refers to a continous variable with 9 levels

The main output is below.

enter image description here

The slope of overlay is = 0.958.

When I change the reference level from adjacent to overlay, the slope of adjacent is -0.958.

Why are the slopes the same but in opposite directions? Below is a graph, and we can see that the slopes are not the same (lines are not perfectly parallel).

enter image description here

How do I compute the slopes of each of these lines from the model? Said differently, how do I compute the slopes for each level of my IV? How do I tell if each of those slopes are significant?