3
$\begingroup$

The fundamental problem of causal inference says that only one potential outcome is observed for each unit.

What happens if both outcomes from control and treatment can be observed? Can we still make use of analysis tools like causal trees to understand heterogeneous treatment effects?

As a concrete example, suppose we are an online search engine and want to better understand how to serve ads. Each time a user enters a search query (request), we pick an ad from a collection of $N$ ads and show it to the user. For each of these $N$ ads, there are 2 versions, one with an image and one without. We randomize users into a control group and a treatment group (same distribution of users in each group), where users in the control group will see ads without an image and users in the treatment group will see ads with an image. By the end of the experiment, for each ad we record the total number of clicks by users in the control group as well as in the treatment group.

In this particular case, each ad is an experimental unit, and we are able to observe outcomes from both the treatment group and the control group. We want to understand if we should add an image to the ads or not.

In addition, each ad has its feature (e.g., associated company, promoted product, etc.), and we want to understand which group of ads will benefit the most from the addition of images. My question is, in such a case, can we follow the routines in treatment effect analysis? If not, what's a more suitable framework?

$\endgroup$
9
  • 2
    $\begingroup$ "if both outcomes from control and treatment can be observed?" Not possible. See The fundamental problem of causal inference. However, with matching one could build similar subjects. $\endgroup$ Commented Dec 13, 2021 at 21:29
  • 1
    $\begingroup$ You don't observe both states simultaneously. This is only true if the ads have no permanent effect on demand and updating beliefs about the platform and there is no selection in who returns for a second exposure. This assumes away things like satiation. $\endgroup$
    – dimitriy
    Commented Dec 13, 2021 at 22:15
  • $\begingroup$ @dimitriy I am assuming the users are split into 2 groups A and B (with same underlying distribution) and group A only see ads with image while group B only see ads without. But what I am trying to understand is how to identify the cohort of ads that are most benefitted from the addition of images. What are the technics I can use here? I am pretty new to the area as you can tell $\endgroup$
    – Ryan
    Commented Dec 13, 2021 at 22:32
  • $\begingroup$ I think you need to edit your question with that detail. $\endgroup$
    – dimitriy
    Commented Dec 13, 2021 at 22:41
  • $\begingroup$ I did mentioned "We randomize users into control group and treatment group, where users in control group will see ads without image and users in treatment group will see ads with image." Just added more detail if that's helpful $\endgroup$
    – Ryan
    Commented Dec 13, 2021 at 23:02

4 Answers 4

5
$\begingroup$

I agree that there is some confusion about the "unit" of analysis here. It's neither the ad nor the viewer, though; it's the instance of showing an ad to a viewer. And there is only one potential outcome observed because that instance can only either have an image or not. Because you randomly assigned, you don't have to worry about confounding, which is nice, but that's not the same thing as having both potential outcomes for each unit.

It happens to be that instances are nested within specific ads, but the specific ad is a characteristic of the instance.

You can estimate a number of quantities from this design. You can estimate the average treatment effect of pictures by simply comparing the outcomes between the instance with pictures and the instance without. You should additionally control for the specific ad and any user-level qualities as well to increase the precision of your estimate and improve estimation of the standard error. To do this, you could fit a fixed effects or random effects model with the treatment as the primary predictor and the specific ad as the fixed or random effect grouping variable, e.g., Y ~ treat + (1|ad) if using lme4 for random effects or Y ~ treat | ad if using fixest for fixed effects (the results should be similar).

You can also estimate the ad-specific treatment effect, which is the effect of showing a picture for a specific ad. This is no different from a subgroup average treatment effect; it is essentially interpreted as if you only had one ad but showed it several times with and without the picture. You can estimate these effects in a single model using the following syntax in R: Y ~ ad/treat - 1 in lm(). This gives you a treatment effect for each ad. This would only make sense if you had many instances of each ad with both a picture and no picture.

If you are interested not in specific ads but perhaps the effect of showing the picture for other user- or ad-level characteristics, you can estimate heterogeneous treatment effects using causal trees in the standard way; you just would not include the specific ad as a predictor if you were looking at ad-level characteristics. If you had specific hypotheses, you could also test them in the models above by including the predictor of interest in an interaction with treatment.

$\endgroup$
5
  • $\begingroup$ I am indeed interested in ad-level characteristic, basically trying to identify ads cohort that is most benefitted from the addition of image. How can I build a causal tree? For each ad I have the following data (total click with image, total click without image, ad characteristic). When using casual tree, I think data is expressed as (realized outcome, indicator on treatment or control, characteristic)? Could you give me some pointers on how to proceed? $\endgroup$
    – Ryan
    Commented Dec 14, 2021 at 0:46
  • $\begingroup$ Thanks for the complement, Noah, that's what I meant. If it's still not clear, Ryan, you can check the definition of SUTVA, which uses the word unit in a causal sense and talks about it. $\endgroup$ Commented Dec 14, 2021 at 0:47
  • $\begingroup$ I understand the unit of experiment is "user request", i.e. (user, ads) pair as an instance, or an impression in terminology of online advertising. I know we can estimate heterogeneous treatment effects on the experiment unit level. Now I am seeing two options to analyze heterogeneous treatment effects on ad - level: (1) treat each impression as a data point (outcome, indicator, characteristic). Here outcome in click or non-click, characteristic basically combine attribute of the user and the ad. With this setup I can directly feed the data to build a causal tree. $\endgroup$
    – Ryan
    Commented Dec 14, 2021 at 1:01
  • $\begingroup$ (2) As mentioned above for each each ad we observe (total click with image, total click without image, ad characteristic). We can treat it as TWO data points (total click, indicator on image or no image(=1), ad characteristic) and (total click, indicator on image or no image(=0), ad characteristic), and proceed as usual. Do any of these ideas make sense? $\endgroup$
    – Ryan
    Commented Dec 14, 2021 at 1:04
  • $\begingroup$ Yes that makes sense. I think it's a better idea to treat impressions as data points but if you only care about ad-level characteristics and your outcome metrics are a bit complicated (i.e., more complicated than total clicks), it can be defensible to look at each ad as the data point, where you indeed have two data points for each ad (one with the picture and one without). You can use causal trees on either type of data. $\endgroup$
    – Noah
    Commented Dec 14, 2021 at 1:12
4
$\begingroup$

You misunderstood the definition of unit there. One unit, individual, can not be in the control group and the treatment group at the same time. You can only observe the effect of ONE intervention on an individual, at a given time. The two types of ads in your exemple are the treatment, say A and B, and the visitors to your website are the individuals, the "patients".

In experiments we see all the time what happens to participants of the study in all groups, but we can not see what happened to Bob when he took the pill and when he didn't take it, ceteris paribus(keeping all the rest constant).

This is not an assumption, so you can not violate it. It's a problem, and one way of solving it, maybe, is traveling in time :-) A bit tricky

$\endgroup$
8
  • $\begingroup$ In my A/B test framework, I am applying the intervention(i.e. adding an images) to the ads and trying to see its effect. In this sense the ads are the units of the experiment. In this case, how can I answer question like "which group of ads will benefit the most from the addition of images?" $\endgroup$
    – Ryan
    Commented Dec 13, 2021 at 21:21
  • 1
    $\begingroup$ How are you measuring the benefit? More clicks on the ads with images when compared to the ads without it? More purchases after clicking on the ad with/out images? $\endgroup$ Commented Dec 13, 2021 at 21:27
  • $\begingroup$ i think whichever metric I am looking won't make a lot of difference? let's say I am looking at number of clicks $\endgroup$
    – Ryan
    Commented Dec 13, 2021 at 21:29
  • $\begingroup$ Let's say that the ads are the units, as you're saying. Can you show, at the same time, to the same individual, the same ad WITH and WITHOUT the image separately? No. The best you can do is to show both at the same time, or one after the other, which is not the same thing. If you give two drugs to a lot of people, and they get better, this does not help you find out which drug, A or B, contributed to what you saw. The ideal way would be to give the ad without image, measure what happened. Then you travel back in time, and show the ad with the image, making sure nothing else changed. $\endgroup$ Commented Dec 13, 2021 at 21:34
  • 1
    $\begingroup$ Yes I am not giving the same ad (with and without image) to the same user. A user can only see one version. I am assuming the two group of users follow the same distribution. In addition I don't care about what happen at per user level. We care about the total click accumulated during the whole period of experiment. I think one potential workaround is to treat an ad as two, one only sees the control flow and one only sees the treatment flow. $\endgroup$
    – Ryan
    Commented Dec 13, 2021 at 22:14
4
$\begingroup$

I would set up your data as an ad-level crosssection, where:

  • Each row is a distinct ad
  • Ad characteristics are the other columns.
  • The outcome column is the treatment-control difference in the two clicks per impression rates.
  • I would also include the number of impressions that the difference is calculated from as a column, in case some ads appear more frequently than others.

You can fit a model of the effect as a function of the ad-level variables, possibly using the number of impressions to weight the data. If you have few ad characteristics relative to ads, linear regression or a non-parametric model will work. If you have many covariates relative to the number of ads, the lasso modified for inference is a good first start:

Belloni, Alexandre, Victor Chernozhukov, and Christian Hansen. 2014. "High-Dimensional Methods and Inference on Structural and Treatment Effects." Journal of Economic Perspectives, 28 (2): 29-50. https://www.aeaweb.org/articles?id=10.1257/jep.28.2.29

This modification is similar in spirit to the causal trees approach you mentioned.

$\endgroup$
0
$\begingroup$

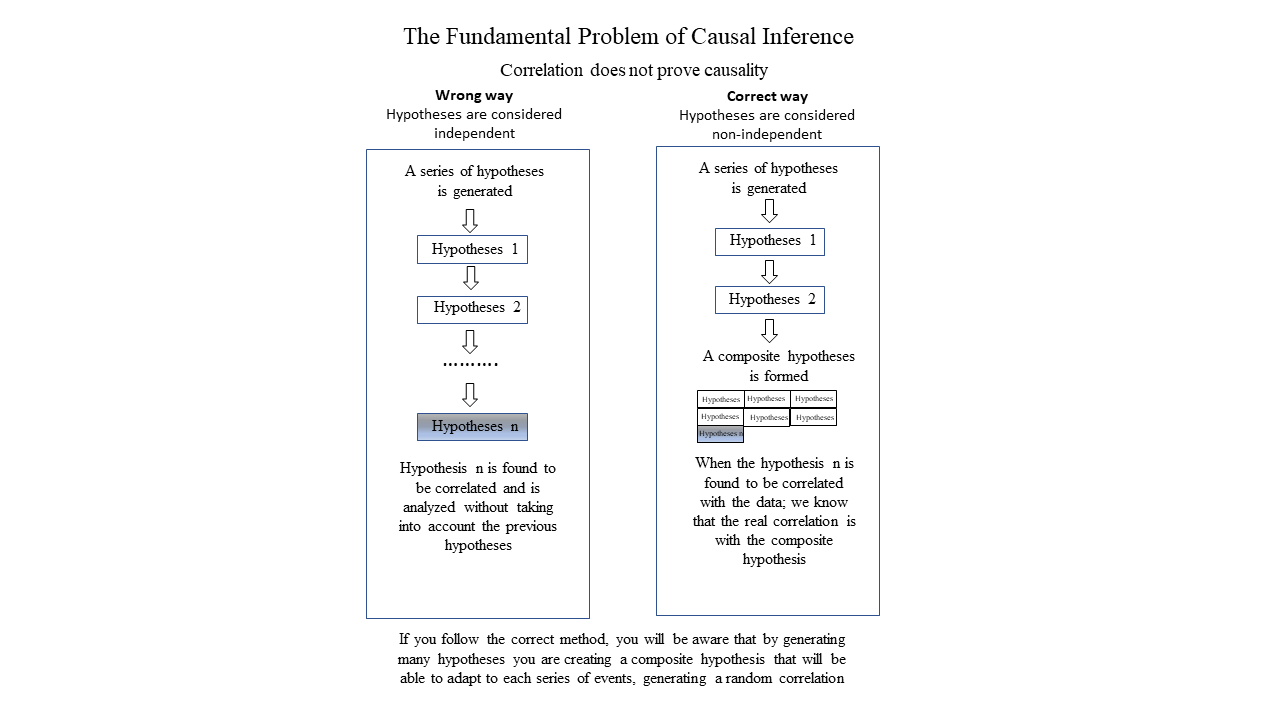
The fundamental problem of causal inference defines the impossibility of associating causality with a correlation; in other words, correlation does not prove causality. This problem can be understood from two perspectives: experimental and statistical. The experimental approach suggests that this problem arises from the impossibility of observing an event both in the presence and absence of a hypothesis simultaneously. The statistical approach, on the other hand, suggests that this problem stems from the error of treating tested hypotheses as independent of each other.

Modern statistics tends to place greater emphasis on the statistical approach, as it, unlike the experimental approach, also provides a path to solving the problem. Indeed, when testing many hypotheses, a composite hypothesis is constructed that tends to cover the entire solution space. Consequently, the composite hypothesis can fit any data series, thereby generating a correlation that does not imply causality.

Furthermore, the probability that the correlation is random is equal to the probability of obtaining the same result by generating an equivalent number of random hypotheses. Regarding this topic, we will see that the key point, in calculating this probability value, is to consider hypotheses as dependent on all other previously tested hypotheses.

Considering the hypothesis as non-independent has fundamental implications in statistical analysis. In fact, every random action we take is not only useless but will increase the probability of a random correlation. For this reason, in the following article “Statistics the Science of Awareness”, we highlight the importance of acting consciously in statistics.

Moreover, calculating the probability that the correlation is random is only possible if all prior attempts are known. In practice, calculating this probability is very difficult because not only do we need to consider all our attempts, but we also need to consider the attempts made by everyone else performing the same task. In fact, a group of people belonging to a research network all having the

same reputation and all working on the same problem can be considered with a single person who performs all the attempts made. From a practical point of view, we are almost always in the situation where this parameter is underestimated because it is very difficult to know all the hypotheses tested. Consequently, the calculation of the probability that a correlation is casual becomes something relative that depends on the information we have.

enter image description here

$\endgroup$

Your Answer

By clicking “Post Your Answer”, you agree to our terms of service and acknowledge you have read our privacy policy.

Not the answer you're looking for? Browse other questions tagged or ask your own question.