1
$\begingroup$

How do you explain a box plot with categorical variables on the x-axis? For example, I have these two box plots, how do you interpret relative comparison of each category within the box plot?

Sample data:

# Create a Pandas dataframe
df = pd.DataFrame({ 
                    'demand': ['low', 'medium', 'high', 'extreme'],
                    'amenities_rating': [3, 2, 3, 4],
                    'education_rating': [1, 2, 2, 4],
                    'dem_ratings': [3, 4, 5, 5]
                 })

plot a

image-1

plot b

image-2

Values on the y-axis are ratings 1-5 with 5 being the best.

$\endgroup$
10
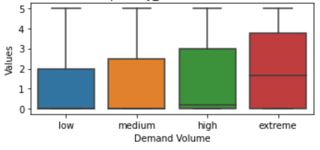
  • $\begingroup$ Well, these plot the distribution of a particular variable, separately for different groups. For instance, in your upper plot, Values has a larger interquartile spread for extreme than for low values of Demand Volume, as well as a higher median, but the minimum, the maximum and the first quartile are identical between the groups. What exactly is your question? $\endgroup$ Commented May 4, 2023 at 16:59
  • $\begingroup$ @StephanKolassa - basically, what can you say about the different categories of demand w.r.t to values on y-axis in both plots? $\endgroup$
    – kms
    Commented May 4, 2023 at 17:06
  • $\begingroup$ Perhaps worth noting that all boxplots have a categorical variable on one axis, this is not any kind of special boxplot. $\endgroup$ Commented May 4, 2023 at 17:27
  • 1
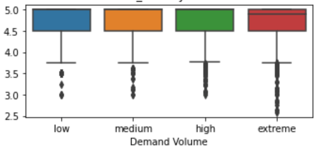
    $\begingroup$ To interpret these correctly, we need to know more about the outcomes being plotted. Plot a appears to be of a variable with possible values 0 1 2 3 4 5, and for such variables box plots are of limited use. For two x categories, 50% or more of values are 0; hence 0 is at once minimum, lower quartile and median. Plot b appears to be of a variable with finer resolution. $\endgroup$
    – Nick Cox
    Commented May 4, 2023 at 17:42
  • 1
    $\begingroup$ Why not show the data, or at least a sample? To my mind behind this question lurks a much more interesting one, how best to plot these data? Too much is hidden here because of ties in the data and the over-emphasis on cut-offs at median $\pm 1.5$ IQR, which are at best arbitrary and at worst quite unhelpful. $\endgroup$
    – Nick Cox
    Commented May 4, 2023 at 18:30

1 Answer 1

1
$\begingroup$

The box plot is simply illustrating that as demand volume gets more extreme - the size of the box within the plot gets bigger, i.e. the range between the first quartile, median and third quartile (those values contained within the box) becomes larger.

The principle remains the same even if the categorical variables were to be on the y-axis - the boxplots would simply be horizontal instead of vertical.

Note that the smallest value and largest value in the series lie outside of the box shape in the box plot and are indicated by the minimum and maximum horizontal lines.

For this box plot, we can see that the middle line for the extreme box plot is higher than that of low, medium and high - indicating that median volume demand is higher.

When looking at plot b - we can see that the dots (which represent the outliers in the dataset) are more numerous and the range is greater - indicating that a wider degree of outliers exists for extreme demand volume.

$\endgroup$
3
  • 1
    $\begingroup$ You're using the word "significantly" pretty loosely here. We cannot conclude from the boxplot itself that the difference is significant, either in a statistical or practical sense. I agree it looks pretty big, but "significant" carries some rather strong connotations. $\endgroup$ Commented May 4, 2023 at 17:32
  • 1
    $\begingroup$ @NuclearHoagie Apologies for any confusion - I was referring to magnitude, not statistical significance per se. However, I have removed the term from my answer as I can see why it might cause confusion. Thanks for pointing this out. $\endgroup$ Commented May 4, 2023 at 17:37
  • $\begingroup$ The last sentence about "a wider degree of outliers" is not firmly based. More points are shown individually on plot b largely because the IQR range is so small at 0.5 in each case, and so any data values below 3.75 (lower quartile MINUS 1.5 * 9,5) are shown as points. But they seem just to be a tail, not outliers in any informal sense (i.e. much separated from the main cluster). Otherwise put, arbitrary box plot conventions have a great deal of influence on what is shown, and that is biting here, not benign. There are better plots possible with these data if only we could see them. . $\endgroup$
    – Nick Cox
    Commented May 5, 2023 at 9:46

Your Answer

By clicking “Post Your Answer”, you agree to our terms of service and acknowledge you have read our privacy policy.

Not the answer you're looking for? Browse other questions tagged or ask your own question.