0
$\begingroup$

In a regression problem, I am trying to analyse the relationship between categorical predictors vs continuous target variable, therefore I opted for plotting with a box plot, but can not infer findings from the plot.

These are statements I've seen pointed out that I don't fully understand :

  1. Comparing the mean of the target variable across categories, I've read somewhere that features with categories that have similar target mean values don't contribute to the target variable, so they are worth dropping.

  2. Features that have class imbalance (most of instances have 1 category) have no information gain and can cause overfitting.

  3. High cardinality features can also causes overfitting.

I am truly confused, if anyone can explain these points to me it would be greatly appreciated. Thank you.

$\endgroup$
2
  • $\begingroup$ I do not follow #1 at all. If one category tends to be about four, and another tends to be about thirty, to which category would expect a value of five to belong? $\endgroup$
    – Dave
    Commented Feb 14, 2021 at 15:42
  • $\begingroup$ My apologies for miss-formulating the 1st statement, it's the one that I don't have a slightest idea about, I just edited that part in the post. I just want to know if the comparison between the distribution of the target variable for each category of the predictor, tells me something about the contribution of this predictor to the target variable (difference in IQR, median, etc). $\endgroup$
    – Melai11
    Commented Feb 14, 2021 at 17:55

1 Answer 1

1
$\begingroup$
  1. Categorical variables are often modelled using one hot encoding. The model is

$$ y = \beta_0 + \sum_{i=1}^p \beta_j x_j$$

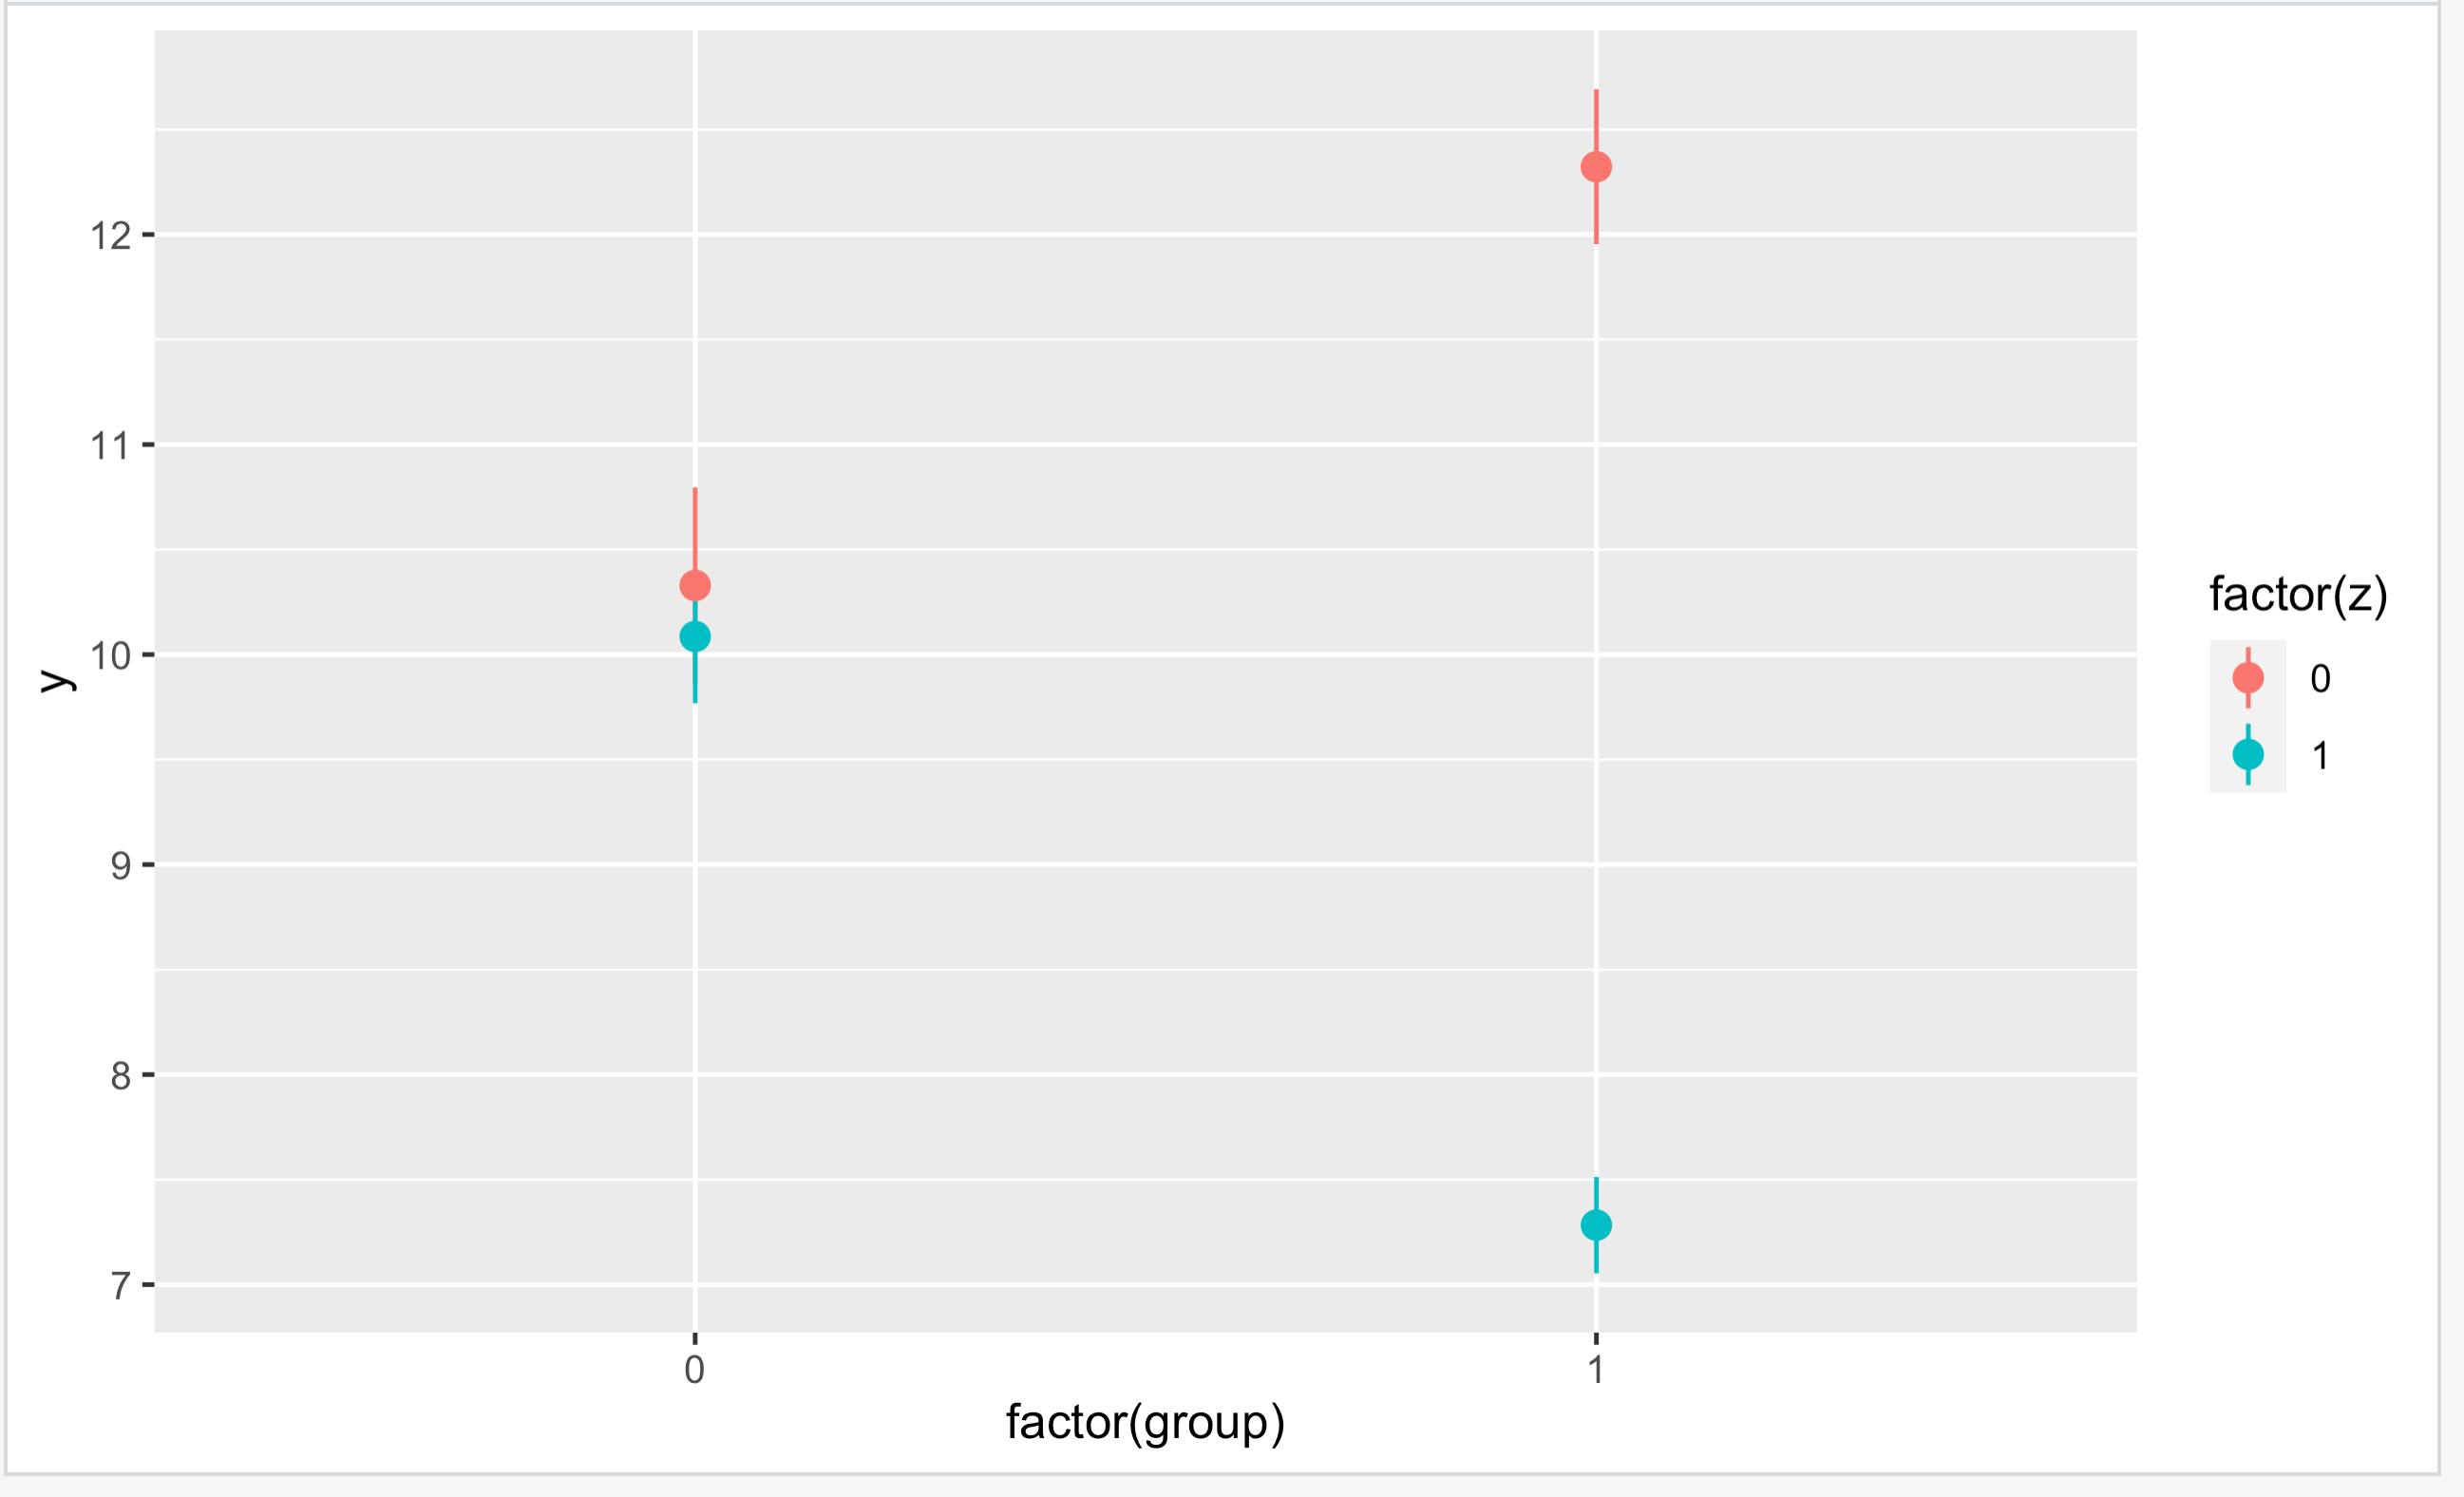
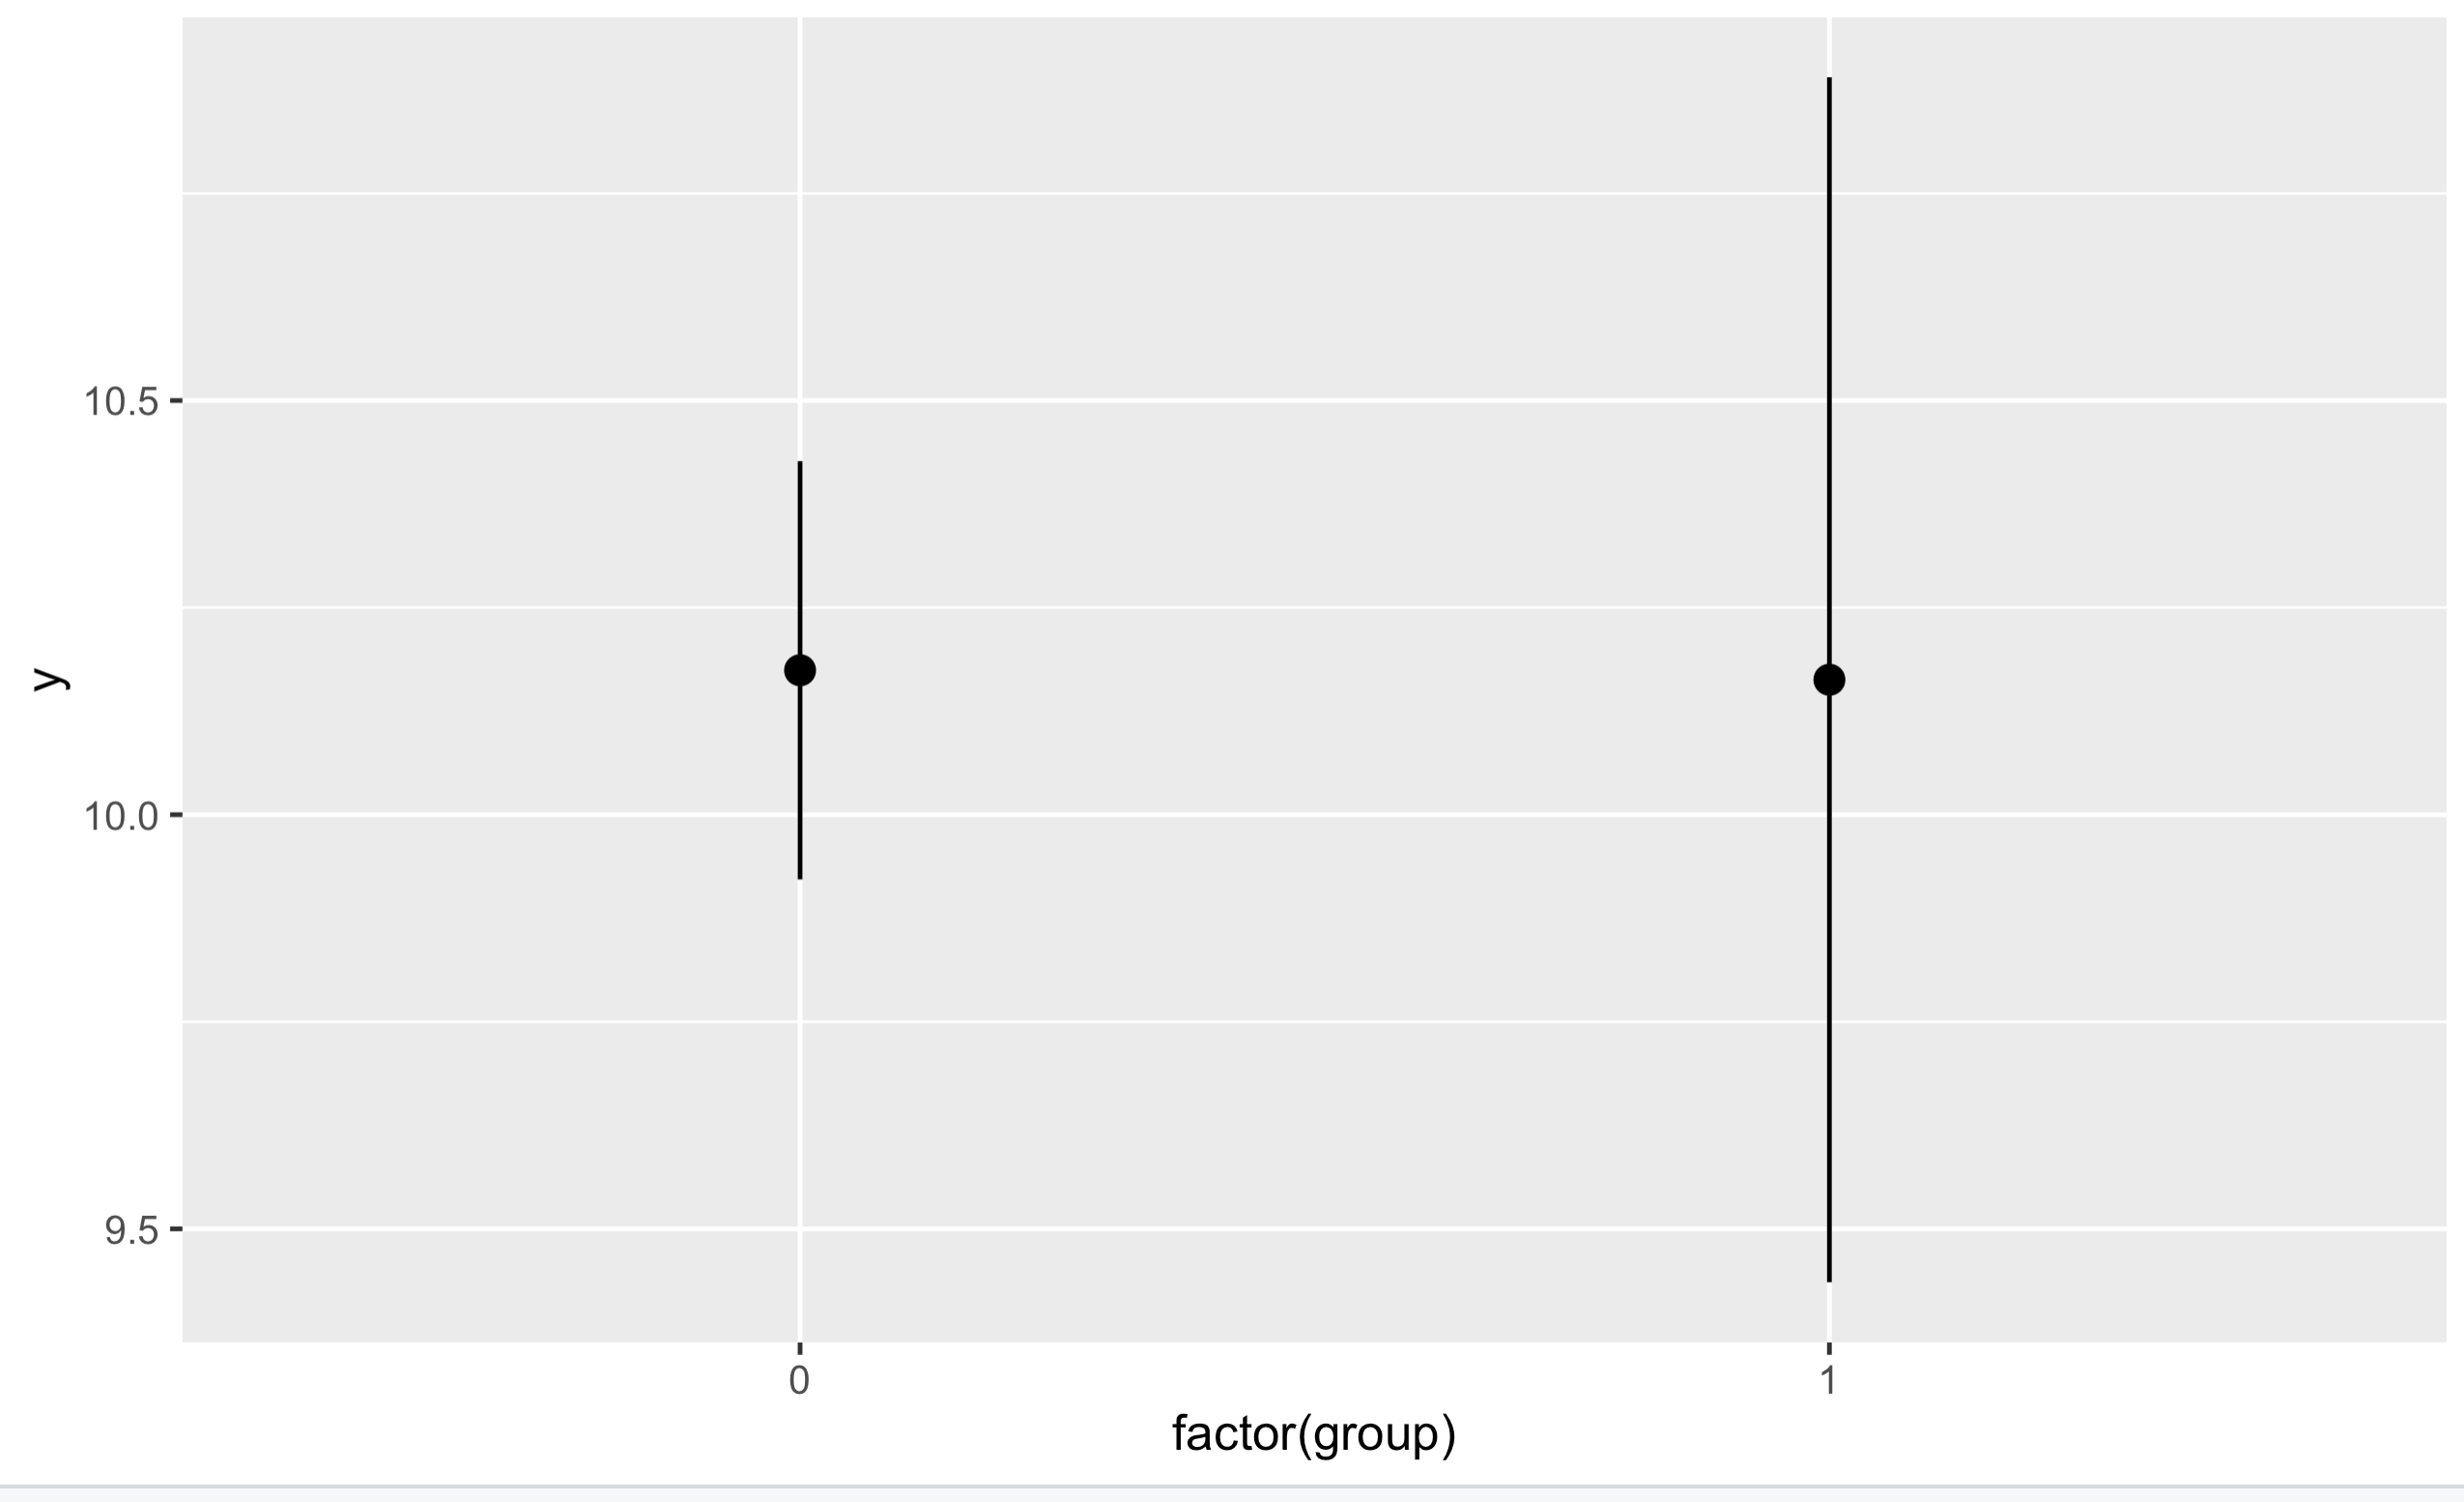
Because the outcome is categorical either all of the $x_j$ are 0 (this is the reference group and is modelled by the intercept) or exactly one of the $x_j$ is 1 meaning that the predicted outcome is $\beta_0 + \beta_p$. If the means in each group are similar, then that means the $\beta_j$ are going to be small, hence the means will be close to the group mean. That is the logic behind the statement, though I don't think I would personally use this logic (as the outcomes could be confounded). Here is an example of that. I've plotted the means of each group plus their confidence interval

enter image description here

The means look the same. However, if you color by a third variable

enter image description here

The means are completely different and you would have lost out on this information had you ignored the group variable simply because the means were the same.

  1. This is specious. If you have a feature which has small prevalence, the sampling variance of this feature is large. It isn't that there is no information, and I certainly don't think it is the case you would overfit unless there are many many categories.

  2. High cardinality means lots of parameters in the model (see the equation above). More parameters means a larger risk of overfitting, but this can be combated by the sample size.

$\endgroup$
1
  • $\begingroup$ Thanks for your answer, So if the group mean doesn't provide info on the value of the variable, could a difference in IQR give us some insights. Imagine using a boxplot to plot the distribution of a target continuous variable across all categories of a feature, what are the points that you're looking for? that you are eventually taking action on like dropping or keeping the feature . for example what kind of insights you can draw from this plot link $\endgroup$
    – Melai11
    Commented Feb 15, 2021 at 10:08

Your Answer

By clicking “Post Your Answer”, you agree to our terms of service and acknowledge you have read our privacy policy.

Not the answer you're looking for? Browse other questions tagged or ask your own question.