2
$\begingroup$

I was initially dealing with huge sets of couple of values. I used a custom heuristic to compute a score from each couple of values and turn the set into an array of values. I sorted it and assigned each value to x and its normalized rank (between 0 and 1, both excluded) to y.

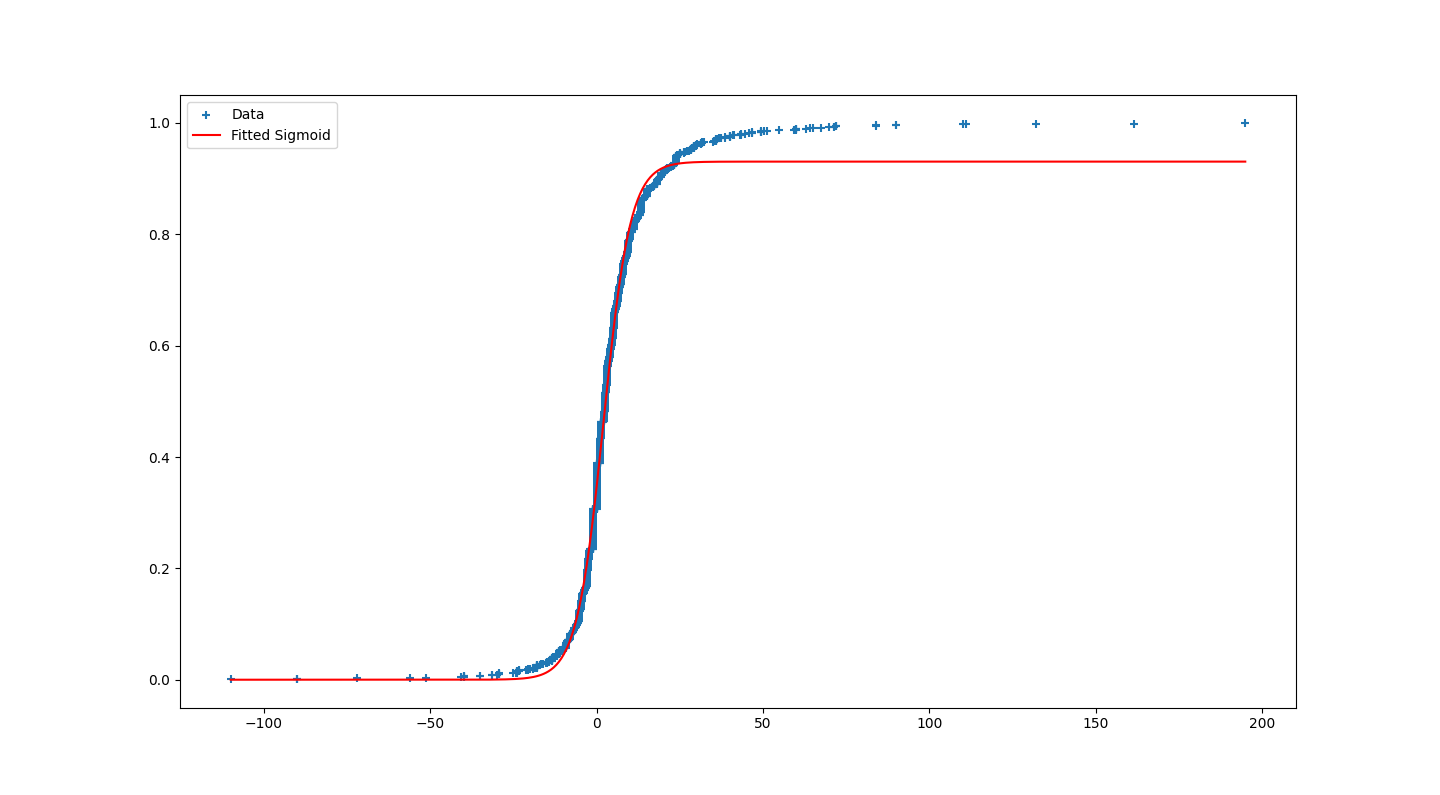
Here is an example :

enter image description here

I tried to fit a sigmoid function but I think it is misled by the huge amount of centered dat and doesn't account for extreme values, whereas I actually plan on using this new function to assign as score between 0 and 1 to any new value. Right now with that solution it would rank to roughly 0.93 any value past a threshold of around 31.

How can I lower the impact of the centered points? I thought about simply removing some but I don't know the right way to do that, if it is even the right way.

Here is my code :

import json
import numpy as np
from scipy.optimize import curve_fit
import matplotlib.pyplot as plt

filename = "scores.json"

with open(filename, 'r') as f:
    data = json.load(f)

x_values = [point['x'] for point in data]
y_values = [point['y'] for point in data]

x_data = np.array(x_values)
y_data = np.array(y_values)

def sigmoid(x, L, x0, k):
    return L / (1 + np.exp(-k * (x - x0)))

initial_guess = [1, np.median(x_data), 1]

params, covariance = curve_fit(sigmoid, x_data, y_data, p0=initial_guess, maxfev=10000)

L, x0, k = params

print(f"Optimized parameters: L = {L}, x0 = {x0}, k = {k}")

plt.scatter(x_data, y_data, marker='+', label='Data')

x_fit = np.linspace(min(x_data), max(x_data), 400)
y_fit = sigmoid(x_fit, *params)
plt.plot(x_fit, y_fit, label='Fitted Sigmoid', color='red')

plt.legend()
plt.show()

And here are the found parameters :

# Optimized parameters: L = 0.9305200252602871, x0 = 2.107303517527327, k = 0.24761667539895446
$\endgroup$
1
  • $\begingroup$ I am currently looking at Kernel Density Estimate to learn how to use it to basically reduce the number of data points such that distance between each other is almost identical. $\endgroup$ Commented Jun 4 at 13:10

2 Answers 2

4
$\begingroup$

This graph is telling you that your assumption about the hypothesis space is wrong; these data do not follow a sigmoid distribution. There are a couple of options:

  1. If you strongly believe a priori that the fitted curve is a sigmoid and should span $(0, 1)$ just as your data does, then L is not a free parameter for you. Hard-code L to 1 and remove it from sigmoid(), initial_guess, and params. This will fix the right asymptote but won't fit the data quite so well in the middle.

  2. Try alternative sigmoid-like curves such as the Gompertz function which is a slightly asymmetric curve that visually matches your data quite well. There are many such functions to choose from.

  3. Use a more general form of curve fitting with more parameters, such as a polynomial. You will probably have the best luck if you transform your data with a logit function (inverse sigmoid) first, do the polynomial fit, then apply the sigmoid to transform it back. (Polynomials like to go to plus or minus infinity at either side, so without the transform it will struggle with these data. With the transform, a cubic or perhaps even quadradic is likely to get you a near perfect fit. Without it, you would need a much higher degree and it would still badly fail to generalize outside the range of the given data.)

  4. Use a non-parametric approach such as LOESS smoothing.

$\endgroup$
2
  • 1
    $\begingroup$ +1 Just a note on terminology: "sigmoid" simply means roughly s-shaped. The sigmoid() function used may not fit the data well because of being symmetrical, but both the data and the function are sigmoid. $\endgroup$ Commented Jun 4 at 21:42
  • 1
    $\begingroup$ Thank you for your anwser. I stopped trying to fit a sigmoid and rather will store the data points and interpolate any new x value that I need some y, as it seems from my tests to be faster that I thought (performance was the reason I was looking for a sigmoid expression). Stats are not my field so I lacked some knowledge and after googling stuff, I think I found out that I didn't need a sigmoid but rather a CPF (cumulative probability distribution). Because as you said, the underlying that might not follow a sigmoid function exactly, even though it somewhat ressemble it at first glance. $\endgroup$ Commented Jun 6 at 13:13
2
$\begingroup$

It would help if you'd make your data available. I tried to reproduce your results by eyeballing your curve and simulating the data, but I get pretty reasonable results.

My simulated data are produced by:

from scipy.special import expit, logit

np.random.seed(3)
N1 = 200
N2 = 200
m1 = 0
m2 = 50
s1 = 25
s2 = 50
x_data = np.hstack([
  np.random.normal(m1, s1, N1),
  np.random.normal(m1, s1/10, N1),
  np.random.normal(m2, s2, N2)
])
x_data.sort()
y_data = expit(5*np.arcsinh(x_data/50) - 3*np.arcsinh(x_data/100))

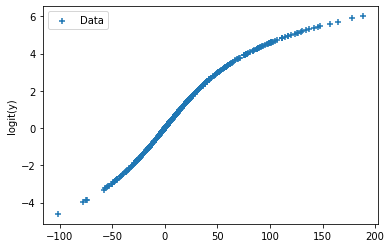
As you see, I introduced non-linearity in the argument of the logistic function (scipy.special.expit), to intentionally make it harder to fit the logistic function. Here are the data on the logit scale, just to see how non-linear they are:

Non-logistic data on the logit-scale

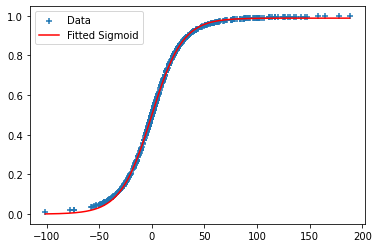
Although the fitted curve still deviates at the tails from the data, the fit is still better than in your question:

Fitted logistic function

The parameters are:

Optimized parameters: L = 0.9879957401154205, x0 = -0.41316625601852847, k = 0.06795385184934516

$\endgroup$
1
  • 1
    $\begingroup$ Thank you! Check my comment above. I found out that I could simply interpolate any new value based on the data points directly, and that I was not really looking for a sigmoid especially but rather any cumulative probability function, because even tought this time it looked like sigmoid, I could have data that look more like log if my data set is made of "top" values, that would have been a sigmoid if the set didn't include so much "top" values. If that makes sense. $\endgroup$ Commented Jun 6 at 13:17

Your Answer

By clicking “Post Your Answer”, you agree to our terms of service and acknowledge you have read our privacy policy.

Not the answer you're looking for? Browse other questions tagged or ask your own question.