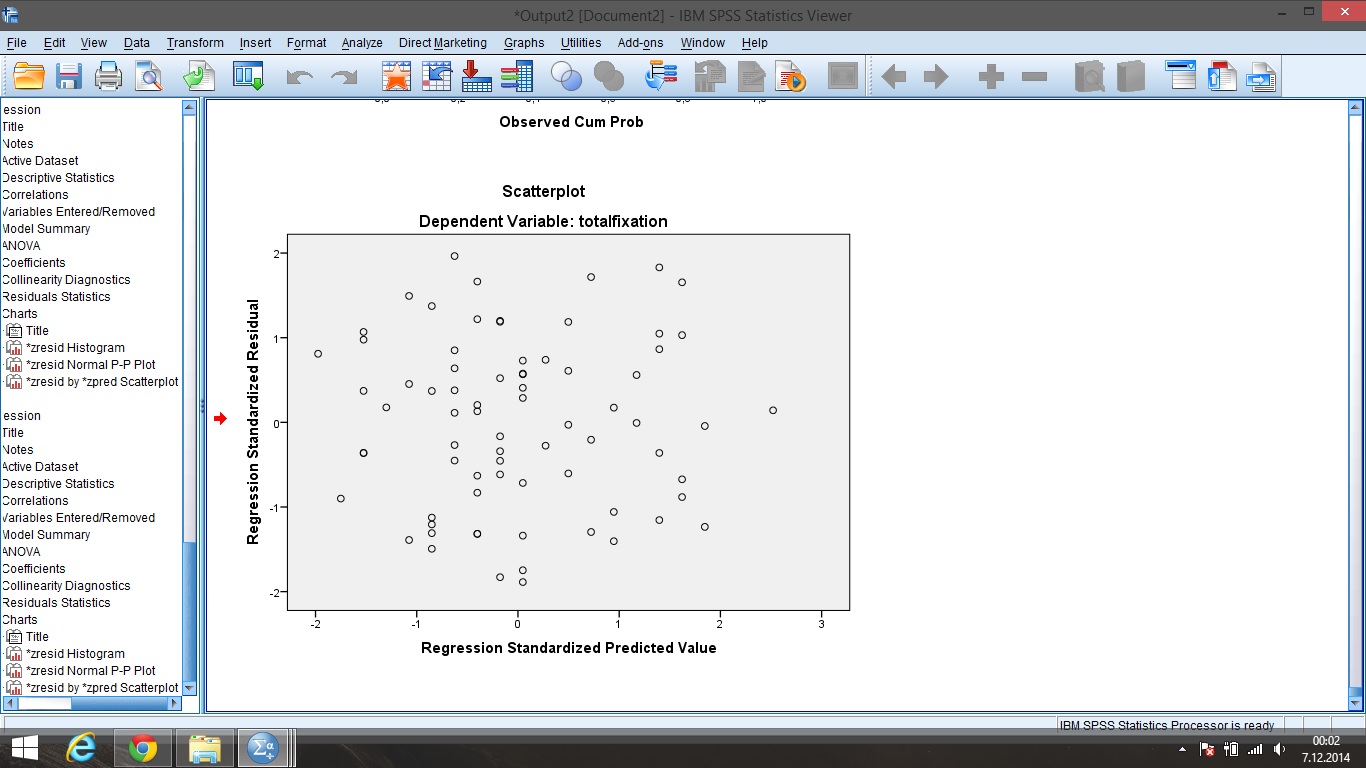
I have 2 continuous variables and I want to conduct a simple linear regression, 1 DV and 1 IV. There is a moderate correlation between them. However, I suspect there may be some heteroscedasticity and I cannot run a regression in SPSS. Also I am not sure if my residual scatter plot really shows a triangle / heteroscedasticity. I have 75 participants. Here is my scatter plot. Any suggestions?
$\begingroup$
$\endgroup$
5
-
2$\begingroup$ I don't really see a triangle here. What makes you think you have heteroscedasticity? The predicted values seem to come in regular intervals / at discrete locations, do you know why that is? Were the original data grouped at fixed intervals on X? $\endgroup$– gung - Reinstate MonicaCommented Dec 6, 2014 at 22:09
-
$\begingroup$ So as i have no heteroscasticity, cant i make linear regression? $\endgroup$– Emrah DolgunsözCommented Dec 6, 2014 at 22:26
-
1$\begingroup$ Note that the existence of Heteroscedacity will not effect the coefficient estimates in the regression but rather only the standard errors of the coefficients. So your estimates from a linear regression will be the same regardless of adjustment. I suppose I can see a "football" like shape to the residual plot which can be a mark of heteroscedacity in certain data. I am not familiar with SPSS but most statistical packages offer a "robust" option in regression which adjusts for heteroscedacity in standard error. $\endgroup$– Zachary BlumenfeldCommented Dec 6, 2014 at 23:58
-
1$\begingroup$ @gung has it right: heteroscedasticity. Show us the scatter plot too, but there is little to worry about in that plot in my view. $\endgroup$– Nick CoxCommented Dec 7, 2014 at 1:58
-
$\begingroup$ Thanks a lot, so it seems i accomplished all assumptions for linear regression. This site is awesome! $\endgroup$– Emrah DolgunsözCommented Dec 7, 2014 at 10:53
Add a comment
|
1 Answer
$\begingroup$
$\endgroup$
From your plot, I don't think there is problematic heteroscedasticity. I think you are OK to run a simple linear regression here.