6
$\begingroup$

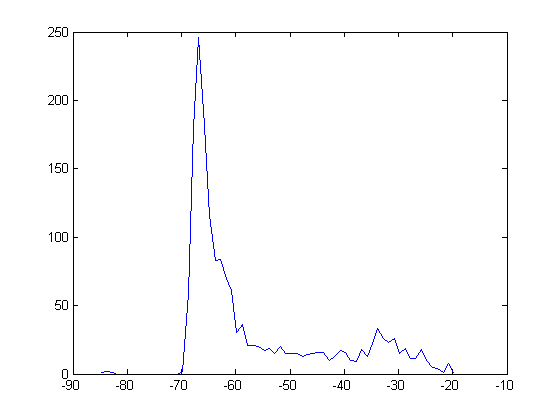
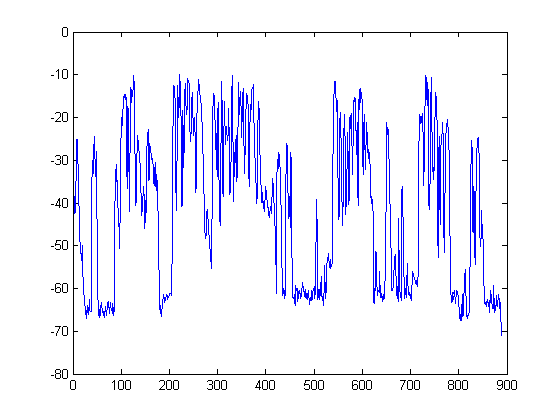
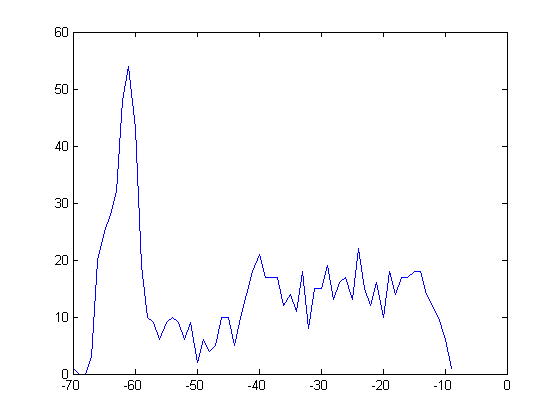
I have histograms of audio signals where they have bimodal "normal" distribution. What I want to do is to detect these subpopulations inorder to have a threshold, this is meant to divide the values into background noise and speech, the background noise and speech as each is meant to have its normal distribution. This is a preprocessing step so it can be used to make later decisions based on it.

Here is my time series of energy value (in DB) and below its corresponding histogram
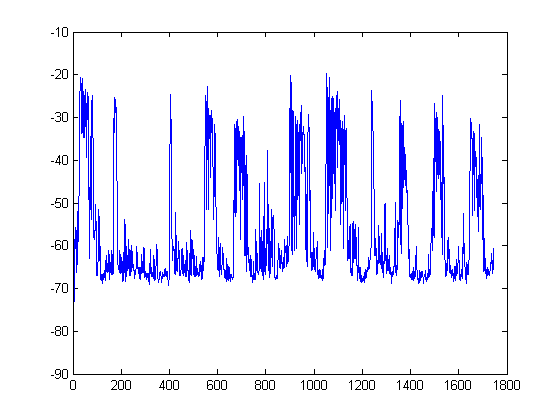
Time Series Histogram

Time Series Histogram

I am thinking of implementing a K-Means clustering algorithm to detect distributions. Now my question is:

  1. Is this the correct solution? Choosing bad initial means is worrying me that the algorithm will fail to cluster correctly.

  2. What are other solutions to separate the two distributions, I have looked at GMM, but am not sure how it helps.

  3. if K-Means is somehow appropriate for solving such a problem how should I select the initial means, or does it depend mostly on the data ?

Note that I am new to this field so I hope to correct me if I made any horrible mistakes

$\endgroup$
8
  • 1
    $\begingroup$ What is the nature of the data? Are these single values (eg intensities) over time, or are they histograms? $\endgroup$ Commented Dec 11, 2014 at 14:45
  • $\begingroup$ You may want to read up on mixture models. $\endgroup$ Commented Dec 11, 2014 at 15:18
  • $\begingroup$ @gung those are histograms, X is energy, Y is frequency/probability. $\endgroup$
    – concept3d
    Commented Dec 11, 2014 at 15:21
  • 1
    $\begingroup$ There is no objective detection of bimodality without some criterion for the "strength" of a mode. You need to worry not only about unimodality vs bimodality but bimodality vs multimodality. See e.g. work on Minotte and co-workers on "mode trees" (citeseerx.ist.psu.edu/viewdoc/summary?doi=10.1.1.30.5736) $\endgroup$
    – Nick Cox
    Commented Dec 11, 2014 at 15:36
  • $\begingroup$ If the problem is working from a histogram, the origin of data as a time series may be irrelevant. $\endgroup$
    – Nick Cox
    Commented Dec 11, 2014 at 15:37

2 Answers 2

7
$\begingroup$

This looks like a typical task of detecting components of a mixture distribution with an umbrella topic being finite mixture models. If you use R, you don't need to implement K-means or other clustering algorithms, as there are enough existing packages that already do that and more.

One of the most popular one - mixtools package (http://cran.r-project.org/web/packages/mixtools) - contains function normalmixEM, which is based on Expectation-Maximization algorithm and can be used to fit your data to a mixture of normal distributions. For more details and examples, see the package documentation and this blog post: http://exploringdatablog.blogspot.com/2011/08/fitting-mixture-distributions-with-r.html. You may find beneficial to read a brief introduction to mixture distributions prior to reading the above-mentioned post: http://exploringdatablog.blogspot.com/2011/06/brief-introduction-to-mixture.html.

Other related packages include rebmix (http://cran.r-project.org/web/packages/rebmix), flexmix (http://cran.r-project.org/web/packages/flexmix) and mclust (for detailed information, please see http://www.stat.washington.edu/mclust and http://cran.r-project.org/web/packages/mclust).

Performing a goodness-of-fit test for estimating a mixture of normal distributions has been frequently discussed on Cross Validated. For example, check this discussion: Goodness of fit test for a mixture in R.

Finally, the following paper might be of your interest, as it addresses the intersection of both topics, related to your question - mixture analysis and speaker identification. I hope that you will find it useful: http://smtp.intjit.org/journal/volume/12/7/127_2.pdf.

$\endgroup$
2
  • $\begingroup$ The last link is dead, could you update it, or add a title for searching? $\endgroup$
    – C. A. J.
    Commented Nov 9, 2020 at 10:25
  • $\begingroup$ @JeffT. Here's the updated link: intjit.org/journal/download/down.php?file=/12/7/127_2.pdf. Reference: Younjeong Lee, Ki Yong Lee, and Joohun Lee. (2006). The Estimating Optimal Number of Gaussian Mixtures Based on Incremental k-means for Speaker Identification, International Journal of Information Technology, 12(7), 13-21. Relevant journal issue page: intjit.org/journal/volume/12/7. $\endgroup$ Commented Nov 9, 2020 at 18:30
2
$\begingroup$

I have often used a scheme (Intervention Detection) even though it is not time series data to determine the presence of "an intercept change" or a change in the mean value. An intercept change is essentially a mean change or in other words a level shift. Please post your data and I will try and help you. Both plots suggest to me a possible intercept change after some anomalies (one time pulses) have been accounted for. In the first course in statistics we are often given the fact that n1 values are in Group 1 and n2 values in Group 2. In actual practice we are often given 1 column of readings possibly a time series and the goal is to determine how many groups there are. This is in effect a form of one dimensional discriminant analysis.

$\endgroup$
2
  • $\begingroup$ Sorry I didn't clarify; my time series is an audio signal for a phone call, the figures are for a histogram, each histogram has binormal distribution, the the left distribution is supposed to be speech the right distribution is supposed to be background noise, so am not sure if this can be considerd an intercept change. $\endgroup$
    – concept3d
    Commented Dec 11, 2014 at 15:54
  • $\begingroup$ As I requested please post both sets of data regardless of the frequency. Just curious I am to understand that this is time series data. If so specify the frequency of readings. $\endgroup$
    – IrishStat
    Commented Dec 11, 2014 at 16:06

Your Answer

By clicking “Post Your Answer”, you agree to our terms of service and acknowledge you have read our privacy policy.

Not the answer you're looking for? Browse other questions tagged or ask your own question.