11
$\begingroup$

I have an obviously bimodal distribution of values, which I seek to fit. The data can be fit well with either 2 normal functions (bimodal) or with 3 normal functions. Additionally, there is a plausible physical reason for fitting the data with 3.

The more parameters that are introduced, the more perfect the fit will be, as with enough constants, one can "fit an elephant".

Here is the distribution, fit with the sum of 3 normal (Gaussian) curves:
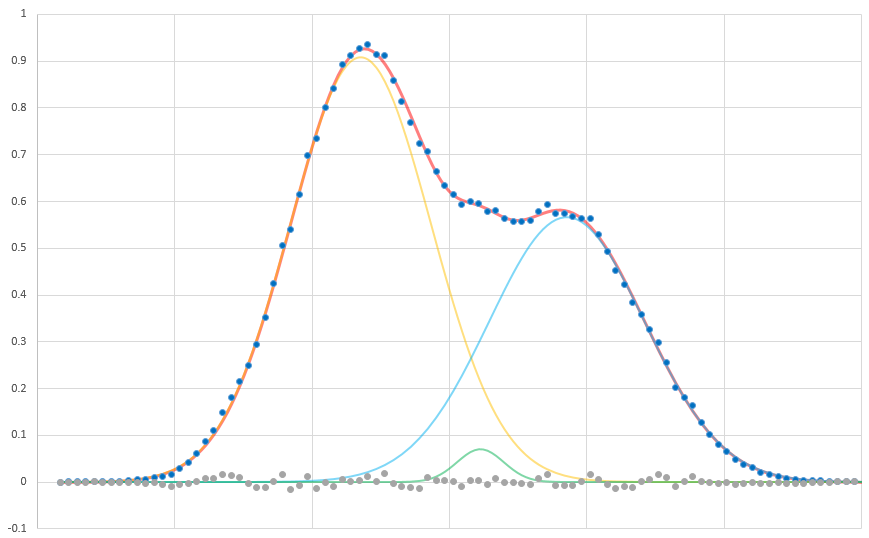
Distribution with

These are the data for each fit. I'm not sure what test I should be applying here to determine the fit. The data consists of 91 points.

1 Normal Function:

  • RSS: 1.06231
  • X^2: 3.1674
  • F.Test: 0.3092

2 Normal Functions:

  • RSS: 0.010939
  • X^2: 0.053896
  • F.Test: 0.97101

3 Normal Functions:

  • RSS: 0.00536
  • X^2: 0.02794
  • F.Test: 0.99249

What is the correct statistical test that can be applied to determine which of these 3 fits is best? Obviously, the 1 normal function fit is inadequate. So how can I discriminate between 2 and 3?

To add, I'm mostly doing this with Excel and a little Python; I don't yet have familiarity with R or other statistical languages.

$\endgroup$
2
  • $\begingroup$ It's been suggested that I use the reduced chi squared X^2/(N-n-1) where N is the number of data points and n is the number of fitted parameters. However the small pentalty (+/-3) relative to the number of data points (91) doesn't intuitively seem like a particularly steep penalty for adding another Gaussian. $\endgroup$
    – MurphysLab
    Commented Mar 24, 2015 at 18:09
  • $\begingroup$ You might want to check this answer (in case you will decide to go the R route). Some model selection criteria are mentioned in this answer. Finally, you may want to consider ensemble methods, which I briefly covered in this answer, which also contains link to Python-focused information. You can find more details on model selection and averaging in this answer. $\endgroup$ Commented Mar 27, 2015 at 10:08

1 Answer 1

7
+50
$\begingroup$

Here are two ways you could approach the problem of selecting your distribution:

  1. For model comparison use a measure that penalizes the model depending on the number of parameters. Information criteria do this. Use an information criterion to choose which model to retain, choose the model with the lowest information criterion (for example AIC). The rule of thumb for comparing if a difference in AIC's is significant is if the difference in the AIC is greater than 2 (this is not a formal hypothesis test, see Testing the difference in AIC of two non-nested models).

    The AIC = $2k - 2ln(L)$, where $k$ is the number of estimated parameters and $L$ is the maximum likelihood, $L = \max\limits_{\theta} L(\theta |x)$ and $L(\theta |x) = Pr(x|\theta)$ is the likelihood function and $\Pr(x|\theta)$ is the probability of the observed data $x$ conditional on the distribution parameter $\theta$.

  2. If you want a formal hypothesis test you could proceed in at least two ways. The arguably easier one is to fit your distributions using part of your sample and than test if the residuals distributions are significantly different using a Chi-squared or Kolgomorov-Smirnov test on the rest of the data. This way you're not using the same data to fit and test your model as AndrewM mentioned in the comments.

    You could also do a likelihood ratio test with an adjustment to the null distribution. A version of this is described in Lo Y. et al. (2013) "Testing the number of components in normal mixture." Biometrika but I do not have access to the article so I cannot provide you with more details as to how exactly to do this.

    Either way, if the test is not significant retain the distribution with the lower number of parameters, if it is significant choose the one with the higher number of parameters.

$\endgroup$
8
  • $\begingroup$ @Momo thanks, changed that and added the equation for AIC $\endgroup$ Commented Mar 27, 2015 at 9:24
  • $\begingroup$ I am not 100% sure but standard AIC may not work as expected in mixture models as different configurations of the mixtures may yield the same model. $\endgroup$ Commented Mar 27, 2015 at 9:26
  • $\begingroup$ What I meant was you can swap the 2 gaussians (by setting the mean/variance of 1st to the 2nd and 2nd to the 1st and also for the mixture wights) and still get the same model. As far as I know AIC doesn't work as expected in such situations. $\endgroup$ Commented Mar 27, 2015 at 9:38
  • 1
    $\begingroup$ @CagdasOzgenc I see your point, but it seems that standard AIC and BIC were shown to be adequate for model selection in gaussian mixture models, see for example the paper projecteuclid.org/download/pdf_1/euclid.aos/1176348772 $\endgroup$ Commented Mar 27, 2015 at 10:09
  • 1
    $\begingroup$ @ChrisNovak yes, a likelihood ratio test (with adjustments to the null sampling distribution from the typical $\chi^2$ with DOF equal to the difference in the dimension of the parameter space) is a good idea. I don't know how complicated the adjustments are but mixtures of $\chi^2$ are typical in these cases. The adjustments are necessary because you are testing a point at the boundary of the parameter space. $\endgroup$
    – Andrew M
    Commented Apr 1, 2015 at 21:25

Your Answer

By clicking “Post Your Answer”, you agree to our terms of service and acknowledge you have read our privacy policy.

Not the answer you're looking for? Browse other questions tagged or ask your own question.