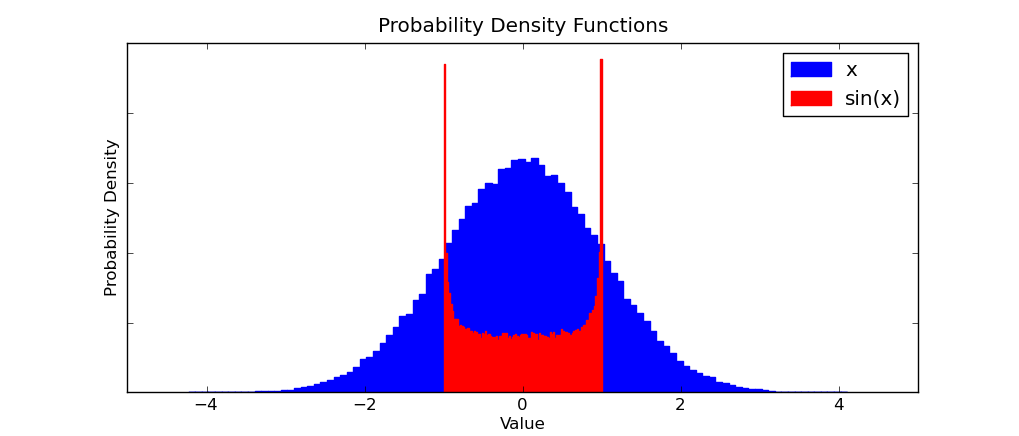
How do probability distributions of continuous random variables transform under functions?
I.e. I have a random variable, X, drawn from a normal distribution with mean 0 and variance 1. What is the probability distribution associated with sin(X)?

More generally, what are the rules for transforming continuous random variables? If we know the PDF and CDF of two random variables, X,Y what is the PDF/CDF of Z=X*Y ? How about Z=X^Y ? How about Z = sin(X+Y)+3?
Are there Computer Algebra Systems which can compute this symbolically? Is this possible generally? If not, for what class of probability distributions and functions is it possible?
Note: excuse the plot. These are obviously noisy histograms and obviously not to scale (areas under the curves do not match and so could not both sum to one). Hopefully the plot does get the point across though. Given the blue distribution describing X, I want the red distribution describing sin(X).
