3
$\begingroup$

I'm trying to analyze for any trends in what I consider to be low observations or counts.

Let's say you have a bus service with the following commuters:

year   average count
2001   12
2002   15
2003   17
2004   13
2005   18
2006   12
2007   9
2008   12

The above numbers are fictitious but similar to what my problem is. How can I analyze the above data for any trends and perhaps attempt to forecast for 2009 to 2012 values?

$\endgroup$
3
  • 2
    $\begingroup$ It appears one of the questions on the right is very similar, stats.stackexchange.com/q/173/1036 , care to elaborate on how that does not answer your question? $\endgroup$
    – Andy W
    Commented Sep 21, 2011 at 17:23
  • $\begingroup$ @AndyW - thanks for the link to the other thread, posted an answer there too :) $\endgroup$
    – Fomite
    Commented Sep 22, 2011 at 1:19
  • $\begingroup$ @Ahmed , If I can help please contact me and we can continue this in a chat room $\endgroup$
    – IrishStat
    Commented Sep 26, 2011 at 16:14

3 Answers 3

0
$\begingroup$

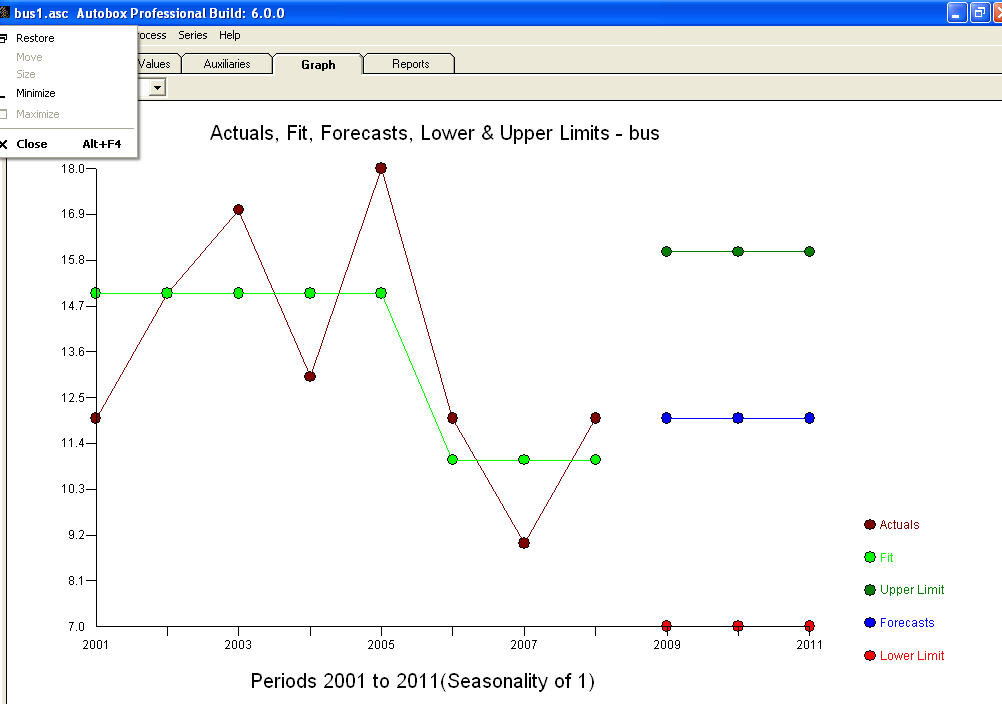
The general approach is to identify and estimate any ARIMA model and then possibly empirically identify Level Shifts, Local Time Trends and unusual Pulses. In this case in the absence of possible predictor variables like population , cost of the service , economoc indicators etc. and having a bare-bones set of data , a simple level shift model does the trick with little (none ) evidence of any auto-correlative structure. The original data is followed by enter image description herefit vs actual and forecasts via a useful equation . In some special biological/pharmacological cases where one has a theory certain special functions such as time**11 power , weibull or some similar model might be appropriate but most of the time they make no sense are are quite dangerous. For more comments on these kinds of "models" please see my comments and Henry's comment on Interpretation of coefficients in polynomial regression for predictive modeling!

$\endgroup$
2
$\begingroup$

Look at TRIM manual. It is software for modelling animal population indices over multiple sites, but the described models can be used for your data too (you would just use one site). You can either use the described software or only get inspired by the models and do it yourself with glm in R, but beware of two main problems: overdispersion and serial correlation of the counts (which I don't yet know how to solve in glm in R). If you don't take the serial correlation into account, your standard errors will be underestimated.

(Anyway, as your data might not be population data, the serial correlation need not to be present...)

$\endgroup$
1
  • $\begingroup$ Clicking on your link, I get what looks like a 'Page Not Found' error. $\endgroup$
    – Fomite
    Commented Sep 21, 2011 at 21:29
1
$\begingroup$

Your counts don't seem that bad to me - they're not great mind you, and you'll likely have some wide standard errors, but that's not the end of the world.

If it makes sense to calculate a rate per time, I'd consider using Poisson regression to model Events (whatever your counts are) per Bus-Year. Adding a few variables to that model for time, perhaps time and time*time, should give you a decent first-pass at the average rate, and how it changes over time - whether its going up or down, or just bouncing about a bit.

$\endgroup$

Your Answer

By clicking “Post Your Answer”, you agree to our terms of service and acknowledge you have read our privacy policy.

Not the answer you're looking for? Browse other questions tagged or ask your own question.