I have a a series of contingency tables, like:
    A   B
  |----|----|
C | 0  | 10 |
D | 17 | 2  |
and I need a numerical value to select and order those tables where:
- (C,A) tends to 0, is much smaller than (C,B)
- (D,B) tends to 0, is much smaller than (D,A)
- (C,B) and (D,A) are > 0, the bigger the better
It doesn't matter if the total of the first row is bigger than the total of the second row.
Example: this table
    A   B
  |----|----|
C | 12 | 41 |
D | 72 | 0  |
is good, and this table
    A   B
  |-----|-----|
C | 178 | 100 |
D | 266 |   1 |
is still OK-ish, but should be ranked lower than the other one. The first row is clearly bad, but the second row makes up for it.
EDIT:
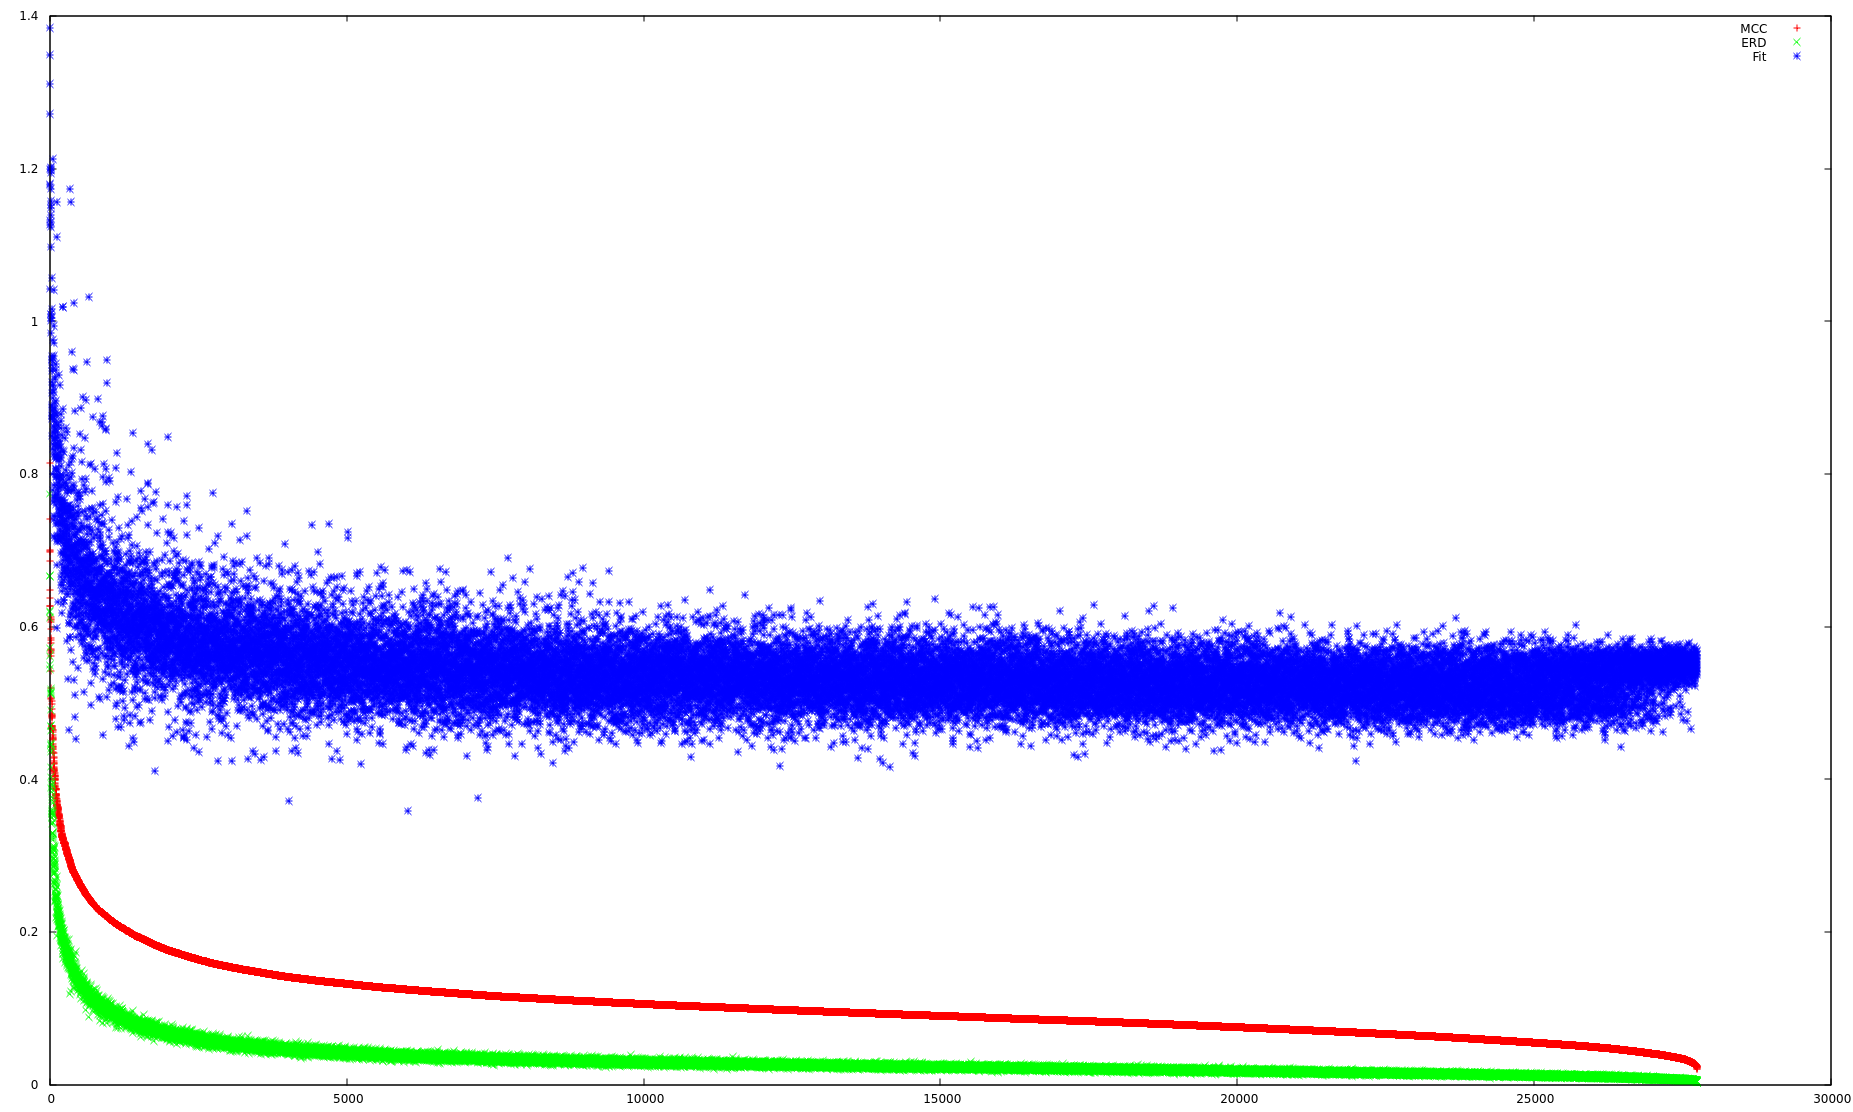
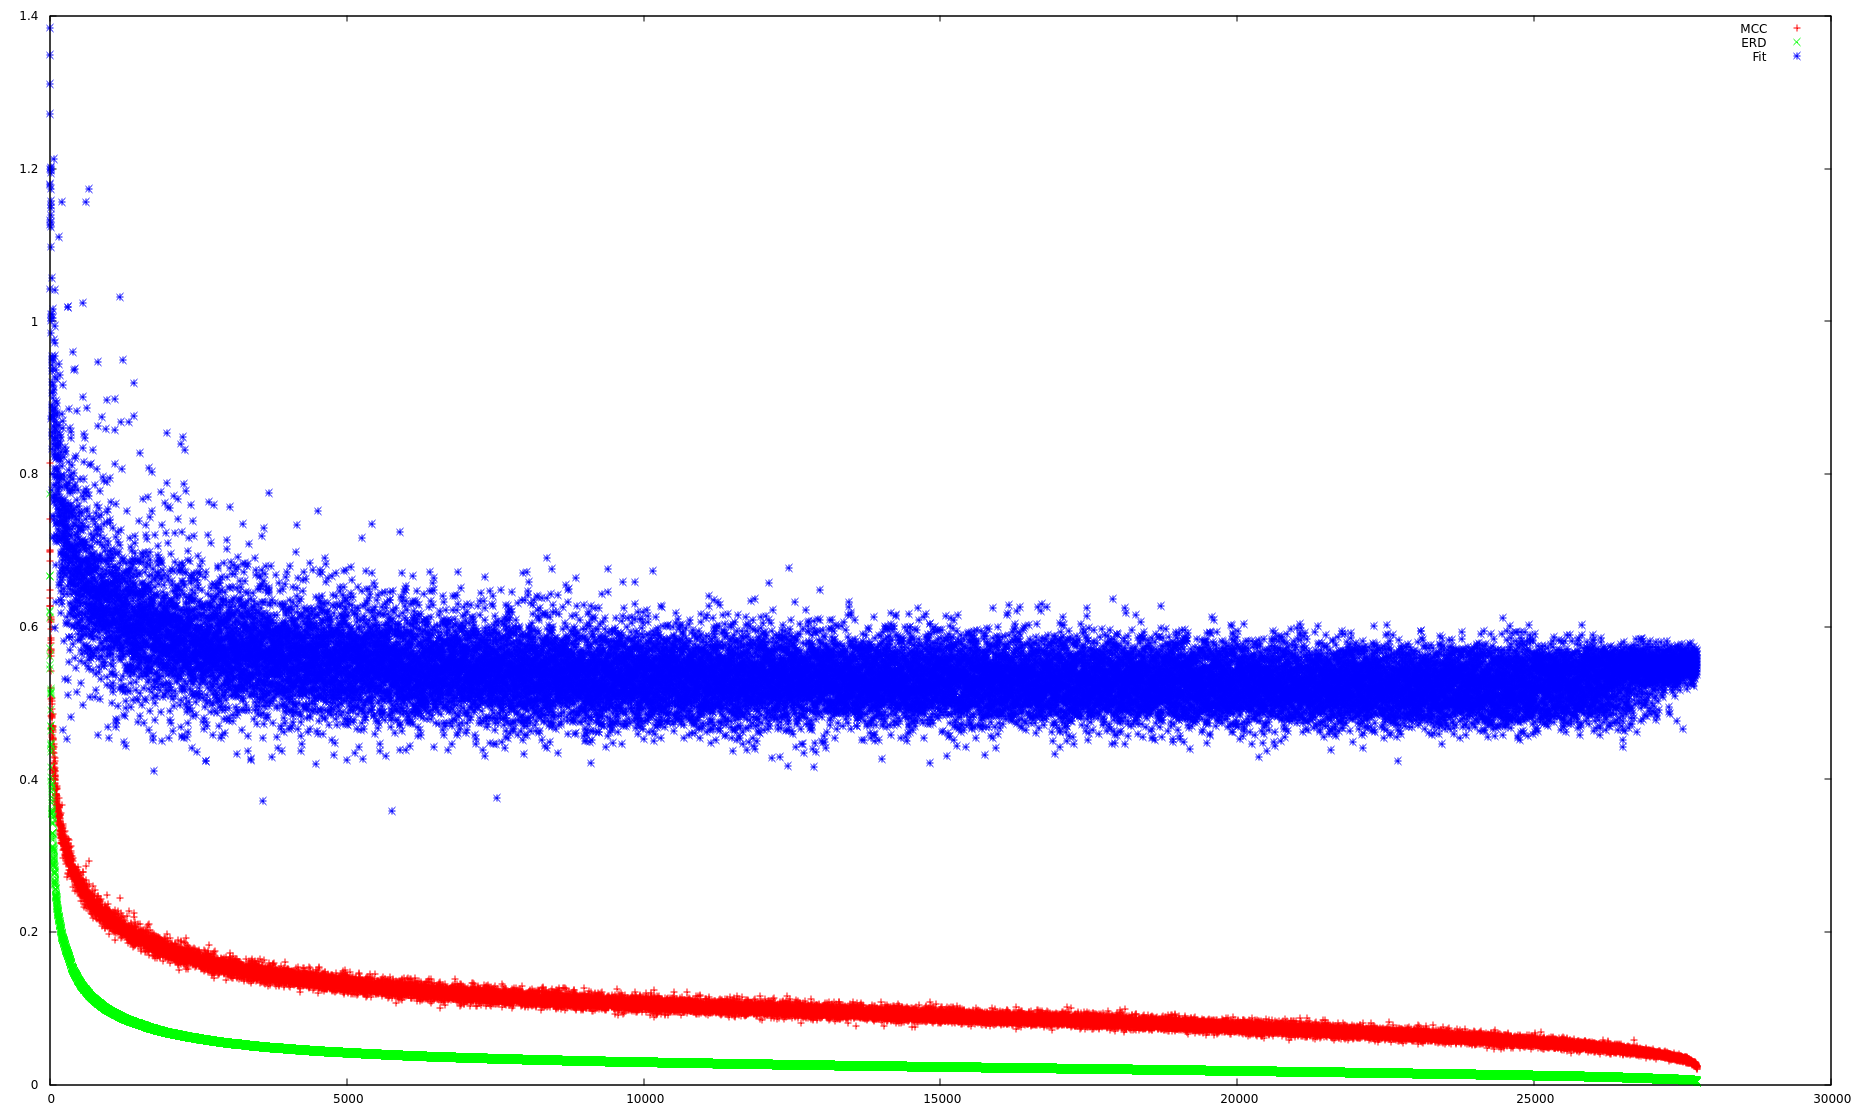
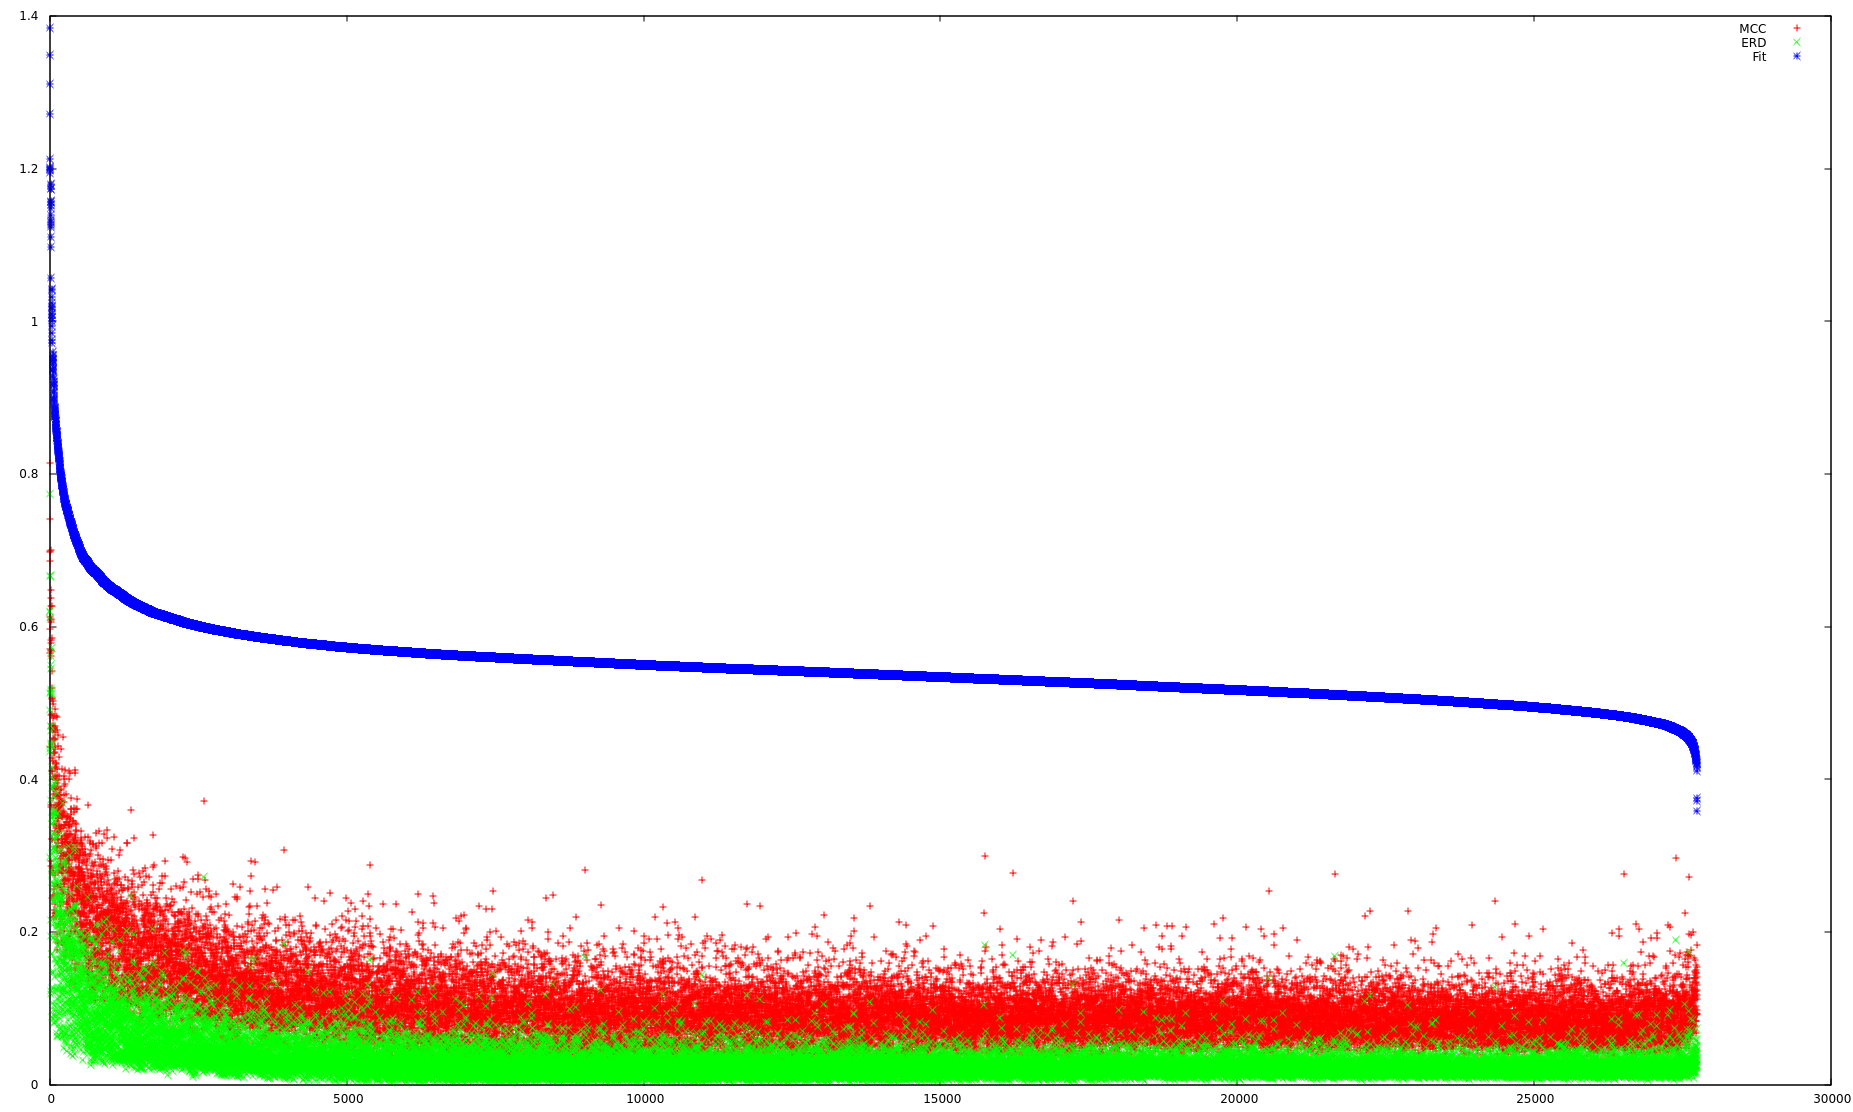
After John's answer, I've plotted the data ordered by three "measures of fit", to compare my two measures against John's.
- Inverse of Matthews Correlation Coefficient (MCC): a "perfect table" as defined above would produce an MCC of -1, while switching columns would provide "1". So doing -MCC and filtering out all values < 0 gives a good filtering/sorting index, and scales nicely between [0, 1].
- Error Rate Difference: proportion of (C,B) on the first row minus proportion of (D,B) on the second row. A value of 1 means that (C,A) and (D,B) are equal to 0. Scales nicely between [0, 1].
- John's fitting expression: doesn't fit into [0, 1], but models the constraints literally.
Here are the plots:


