3
$\begingroup$

I have a a series of contingency tables, like:

    A   B 
  |----|----|
C | 0  | 10 |
D | 17 | 2  |

and I need a numerical value to select and order those tables where:

  • (C,A) tends to 0, is much smaller than (C,B)
  • (D,B) tends to 0, is much smaller than (D,A)
  • (C,B) and (D,A) are > 0, the bigger the better

It doesn't matter if the total of the first row is bigger than the total of the second row.

Example: this table

    A   B 
  |----|----|
C | 12 | 41 |
D | 72 | 0  |

is good, and this table

    A   B 
  |-----|-----|
C | 178 | 100 |
D | 266 |   1 |

is still OK-ish, but should be ranked lower than the other one. The first row is clearly bad, but the second row makes up for it.

EDIT:

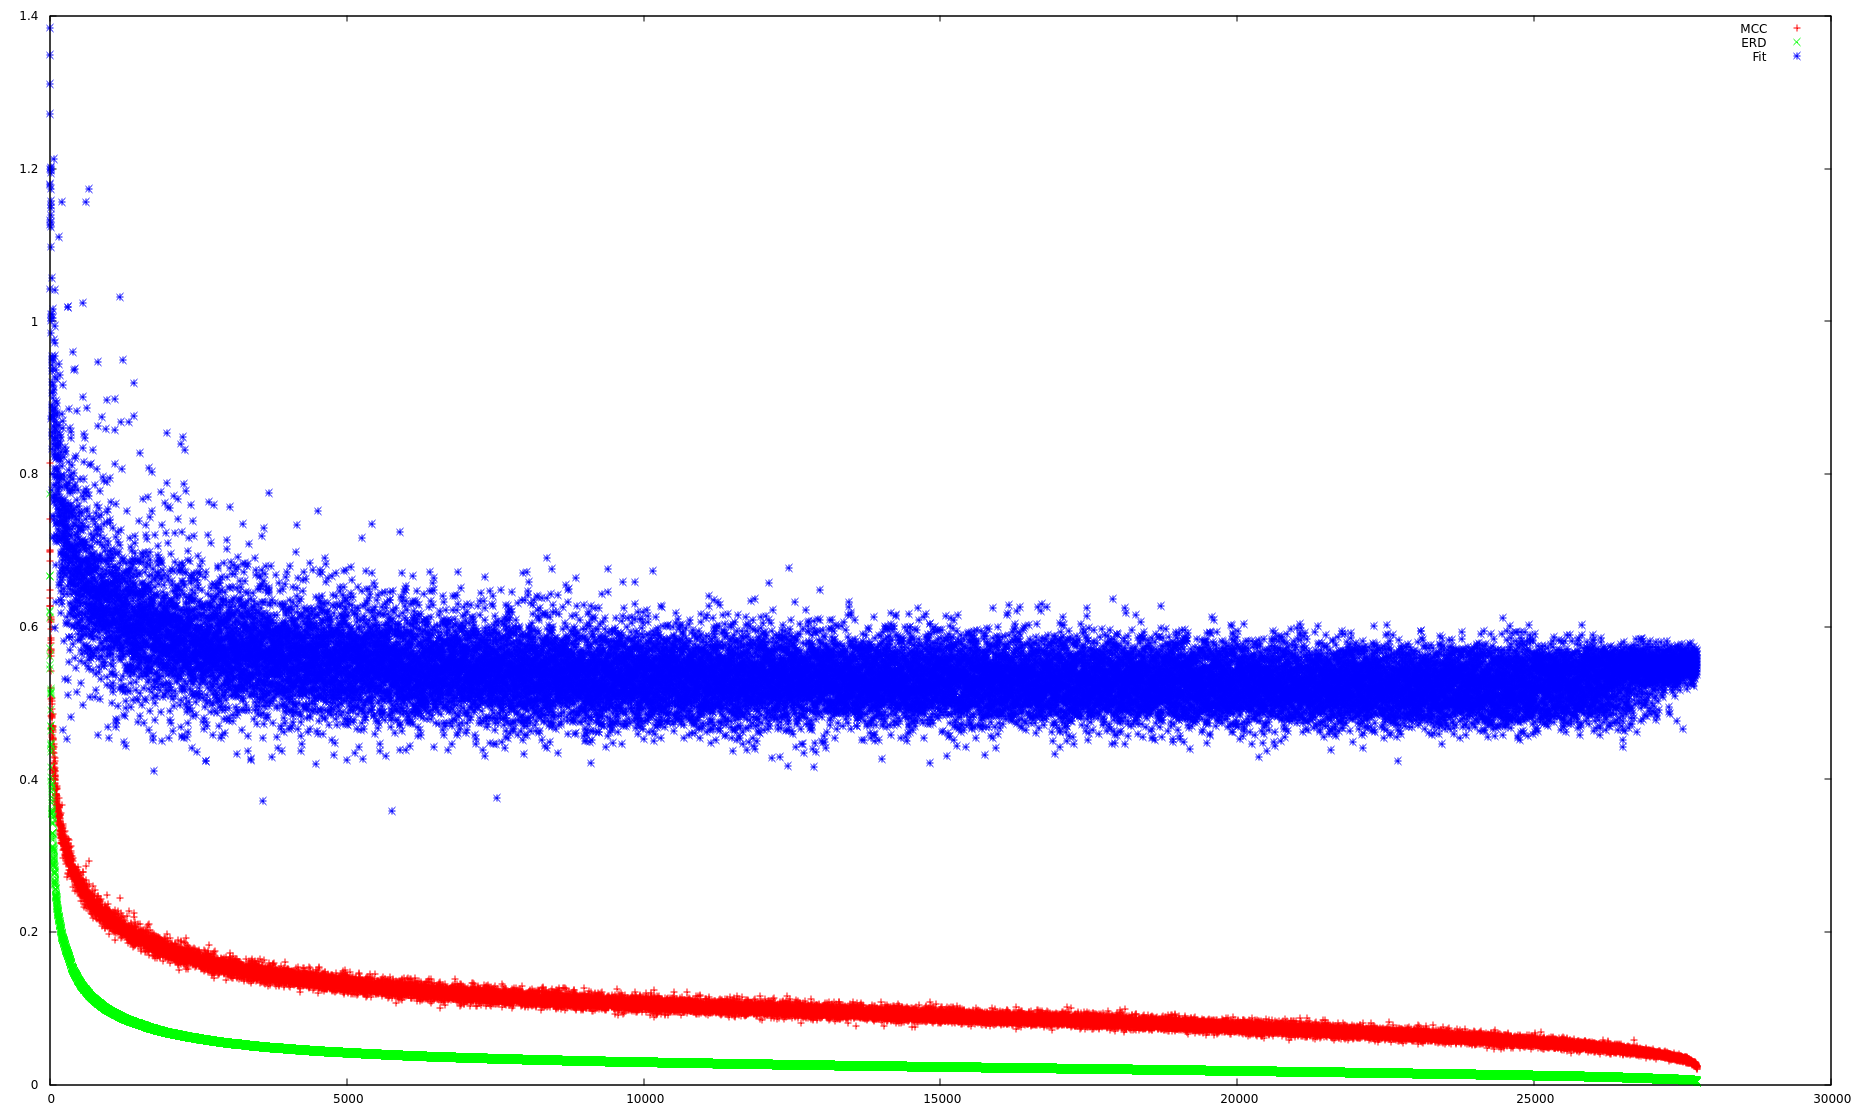
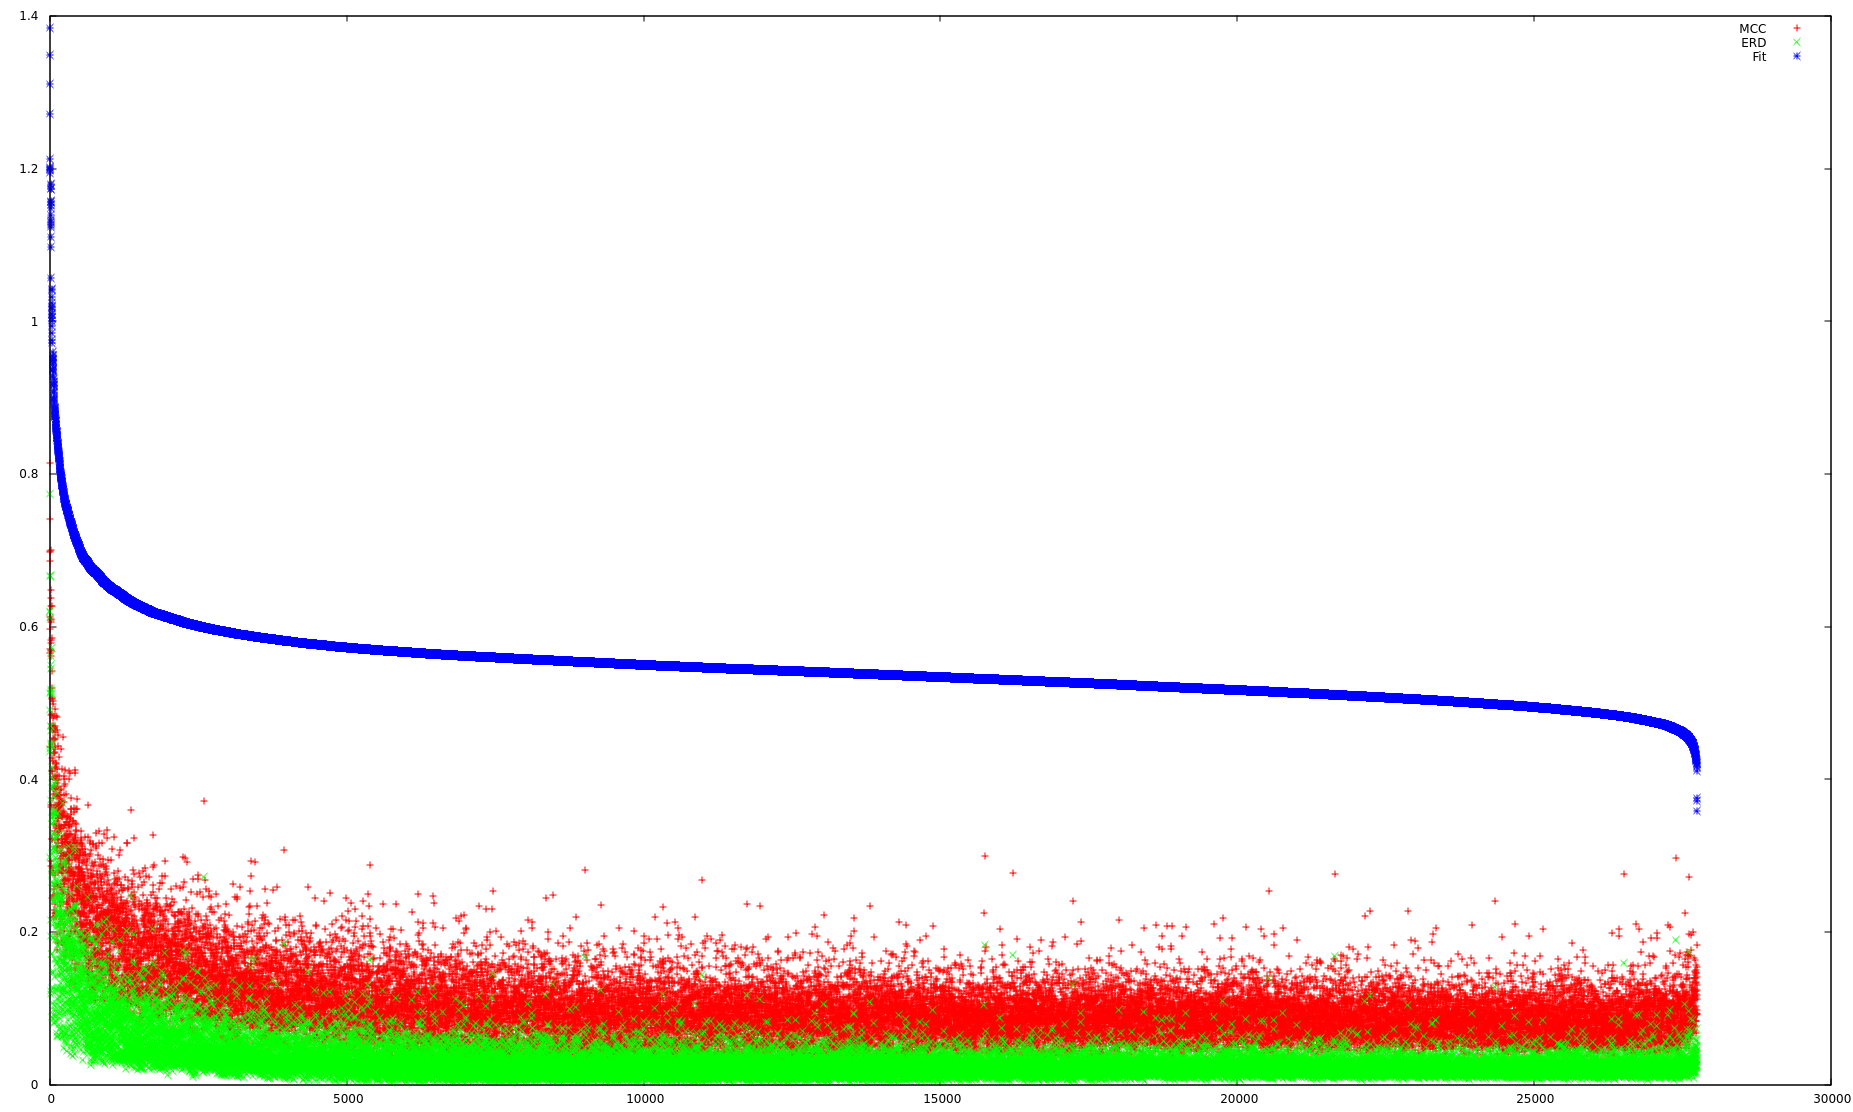
After John's answer, I've plotted the data ordered by three "measures of fit", to compare my two measures against John's.

  1. Inverse of Matthews Correlation Coefficient (MCC): a "perfect table" as defined above would produce an MCC of -1, while switching columns would provide "1". So doing -MCC and filtering out all values < 0 gives a good filtering/sorting index, and scales nicely between [0, 1].
  2. Error Rate Difference: proportion of (C,B) on the first row minus proportion of (D,B) on the second row. A value of 1 means that (C,A) and (D,B) are equal to 0. Scales nicely between [0, 1].
  3. John's fitting expression: doesn't fit into [0, 1], but models the constraints literally.

Here are the plots:
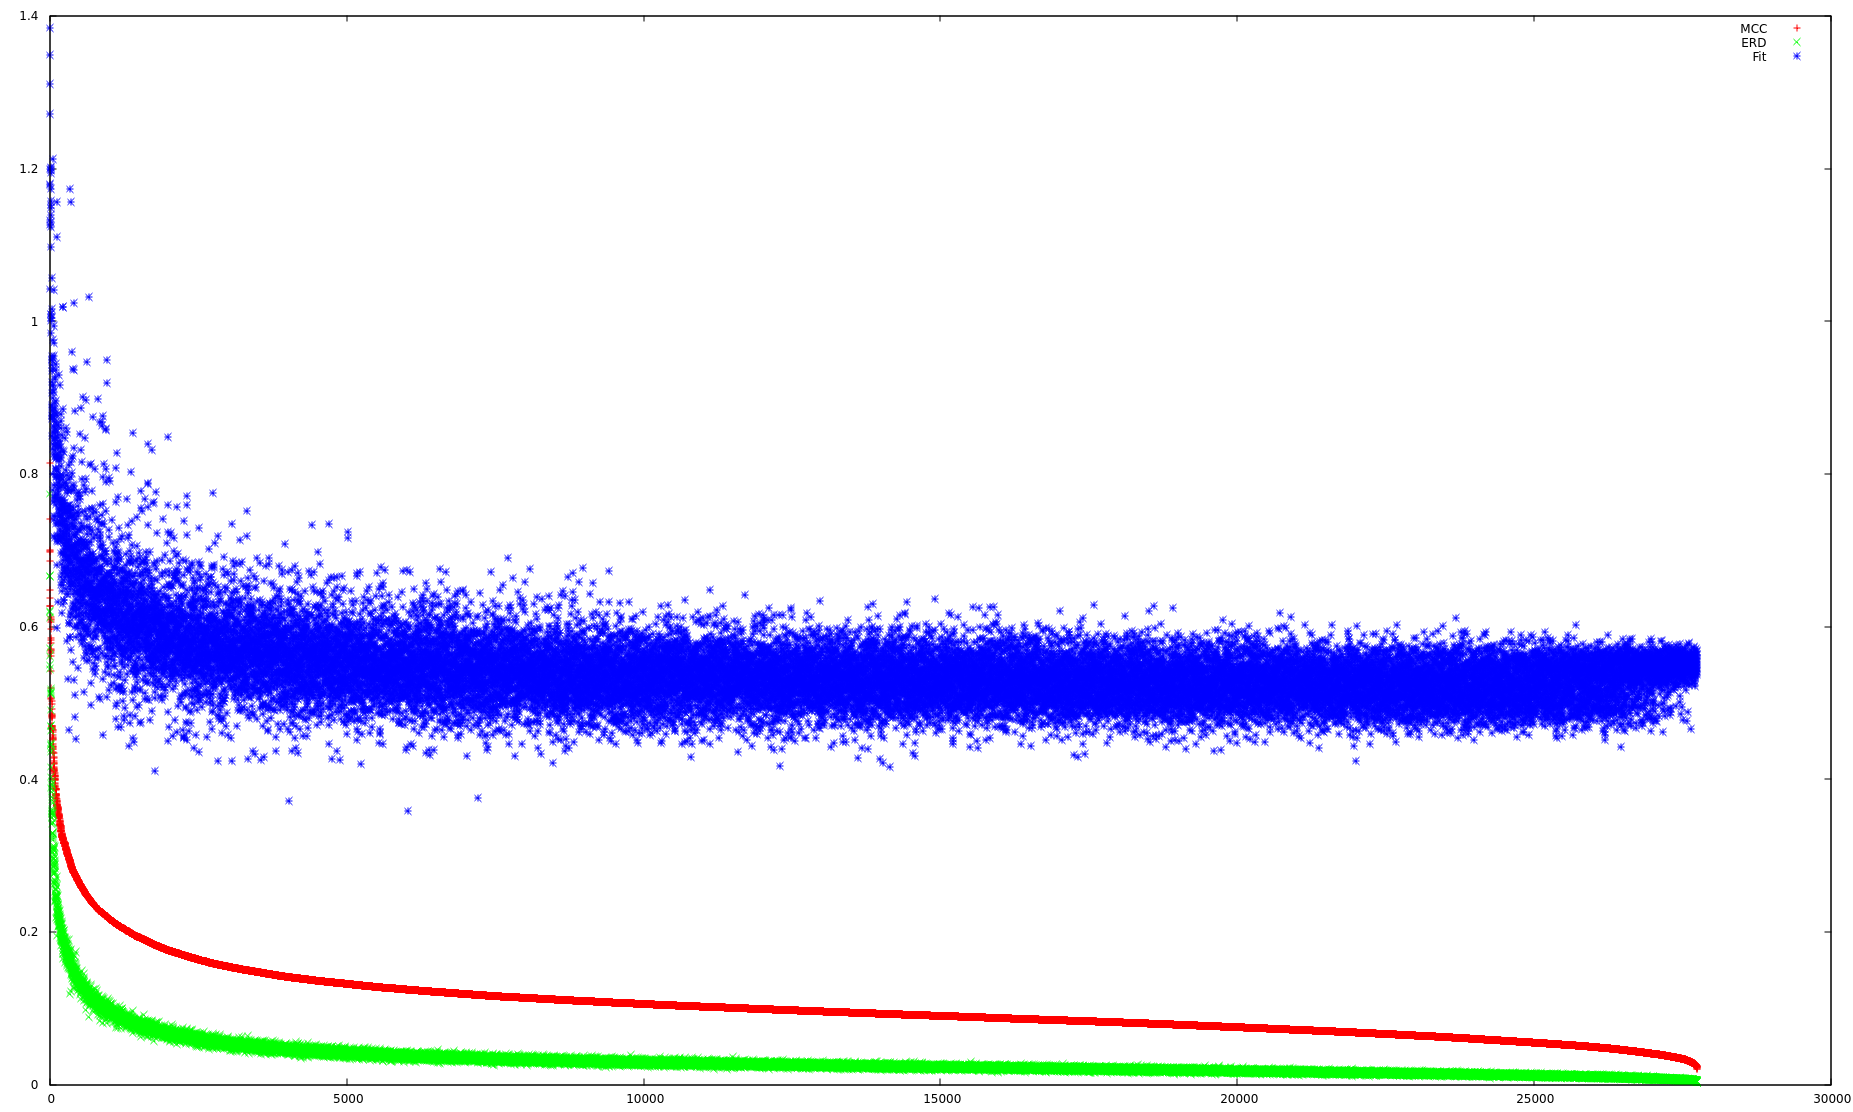
Data ordered by -MCC

Data ordered by ERD

Data ordered by John's fitness function

$\endgroup$
8
  • $\begingroup$ This looks like two questions so it's broader than is usually desired here (moreso than you realize). Edit this so that it's just about how to solve your fitting problem. If, after you get an answer you still want to ask about p-values as measures of fit then do that after. And also edit the problem because there's lots of superfluous information that's in some ways a little misleading. All you need is the contingency table and the statement A >> B is good but it must have z >> 0. That would satisfy the whole thing I think. Could x be small? Anyway, be clearer on what you need to fit. $\endgroup$
    – John
    Commented Jul 10, 2015 at 14:40
  • $\begingroup$ I've tried to shorten it as much as I can. Thanks for the tip. $\endgroup$
    – Fabio
    Commented Jul 14, 2015 at 13:13
  • $\begingroup$ I thought before you also said that A should be larger than B. $\endgroup$
    – John
    Commented Jul 14, 2015 at 22:34
  • $\begingroup$ In the original answer I spoke of both "good tables" and "bad tables", and differentiated the cases. This got a bit confusing. The ones respecting the property A >> B are "perfectly good" tables - but I'm not looking for those. In the above, there is no ambiguity: those tables are the ones I need to identify and order by "extremeness", following the pattern I specified. I hope it's clearer. Thanks. $\endgroup$
    – Fabio
    Commented Jul 15, 2015 at 15:00
  • $\begingroup$ Your original two measures don't take into account your third condition (two cells greater than 0). As far as I can see they only take into account the proportion on a row which would cover the first two conditions. My formula includes the third condition. You need to decide on the importance of that. And further, artificially constraining your measurements between 0 and 1 is almost never a good idea. Have you really thought about why you're doing that? $\endgroup$
    – John
    Commented Jul 16, 2015 at 15:19

1 Answer 1

1
$\begingroup$

Your original suggestion to use p-values was problematic in a number of ways. The biggest one is probably that they're dependent upon N such that a table with a small number of values but very well fit what you desire would have a higher p-value than one that had more values but didn't fit nearly so well.

How about just using the requirements you set out as the measure? The function below just turns your list of requirements into a simple equation. The numerator can be larger than the denominator but only when the requirements are strongly met. I don't think this is going to be too dependent on N but you should try and see what it looks like. Check the distribution of values and see if it's reasonable.

You might also note that I flattened your matrices. The indexes I used will match the matrices and this will function with a matrix or a vector. So if you already have all of the tables as matrices this would work just fine.

good <- c(12, 72, 41, 0)
ok <- c(178, 266, 100, 1)
bad <- c(178, 26, 100, 40)

myStat <- function(y){
    ( (y[3] - y[1]) +  (y[2] - y[4]) + y[2] + y[3] ) / sum(y)
    }

myStat(ok)
myStat(good)
myStat(bad)

When I generate some random binomial data I get a normal distribution centred on 0.5 which makes sense if you look at the equation carefully. If your criteria are correct high scores will be "good" matrices and low score "bad". Now that you've got normally distributed values you can pick one of many stats to analyze them. But even if they're not normal there are still a variety of options either non-parametric or one that models the observed distribution.

$\endgroup$
1
  • $\begingroup$ Thanks for the input. I am already using two other formulas but can't decide on one: Fisher's has the advantage of being an exact test and widely used in the literature (although recently I've seen many papers contesting its use). I've updated the question with the other two measures I'm using, and I've plotted my data by ordering it by each of them in turn. It seems to me that the ERD is very conservative, MCC is more loose, and the fitness function you provided is difficult to compare because it's not between [0, 1]. $\endgroup$
    – Fabio
    Commented Jul 16, 2015 at 12:50

Your Answer

By clicking “Post Your Answer”, you agree to our terms of service and acknowledge you have read our privacy policy.

Not the answer you're looking for? Browse other questions tagged or ask your own question.