I work with Google Adwords. Recently Google has changed its layout regarding its ads. And I want to measure what was the impact of that change.
I don´t want to do a super analysis, but I would like to do more than just look at the chart and say: "this line goes up". I had an idea of how to measure that: however, I not very sure if it´s the correct way and if my reasoning makes sense.
We pay our ads on Google according to how many people click on the ads. It´s called CPC (cost per click). The ads appear on Google according to a bid: I compete against other people who also want to show their ads. Prior to the change in layout there were 10 spots to show ads; now there are 5.
My hypothesis is that, with fewer spots, there will be more people competing per spot, the bids will get higher and therefore my CPC will be higher.
I need to check if this is indeed the fact.
My idea is to get a time series, trace a tendency line and see the angle of this line. I have to do that for about 60 accounts. If most of the angles are positive I can deduce that the CPC has increased; if most have a angle close to zero or negative, I can deduce that there were no increases in CPC. I think I can also calculate the chi-square to see how relevant these results are.
Will this work? Is there a better way? Is it possible to do this with Excel or Google spreadsheet (preferably Google spreadsheet)?
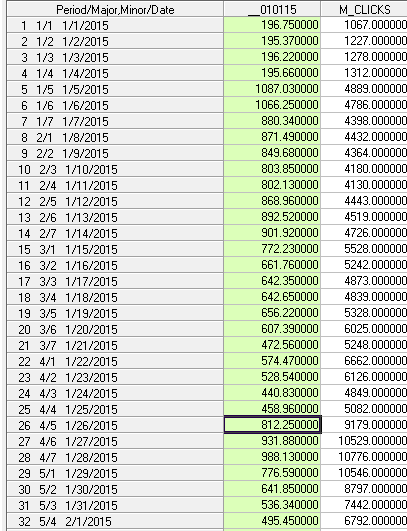
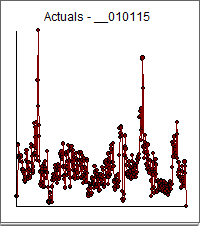
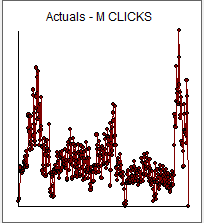
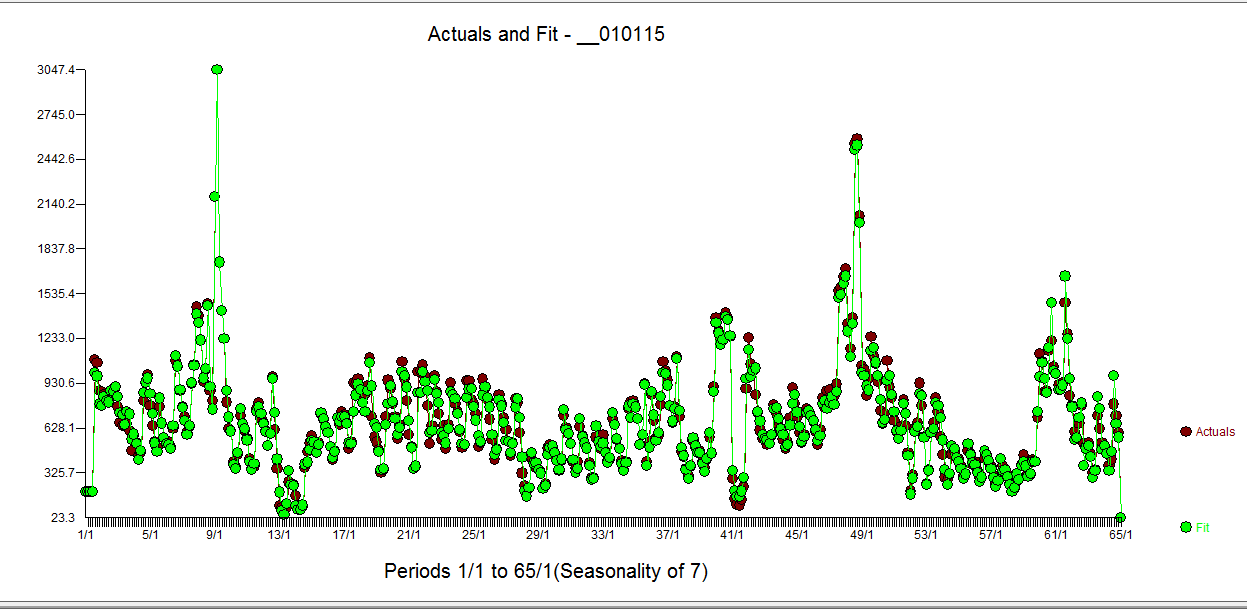
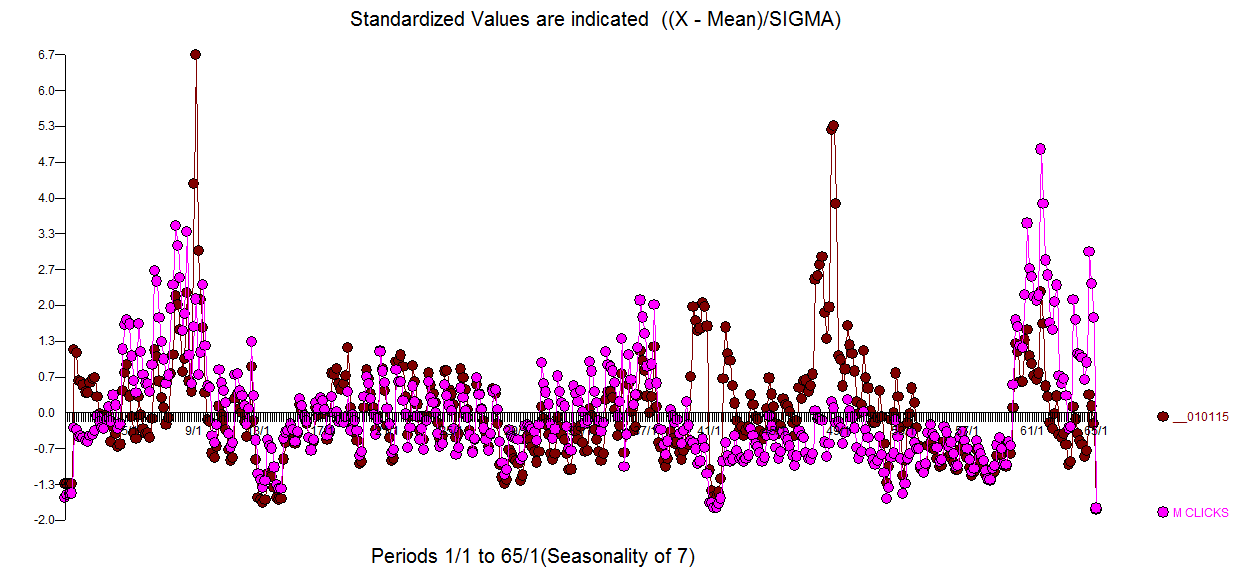
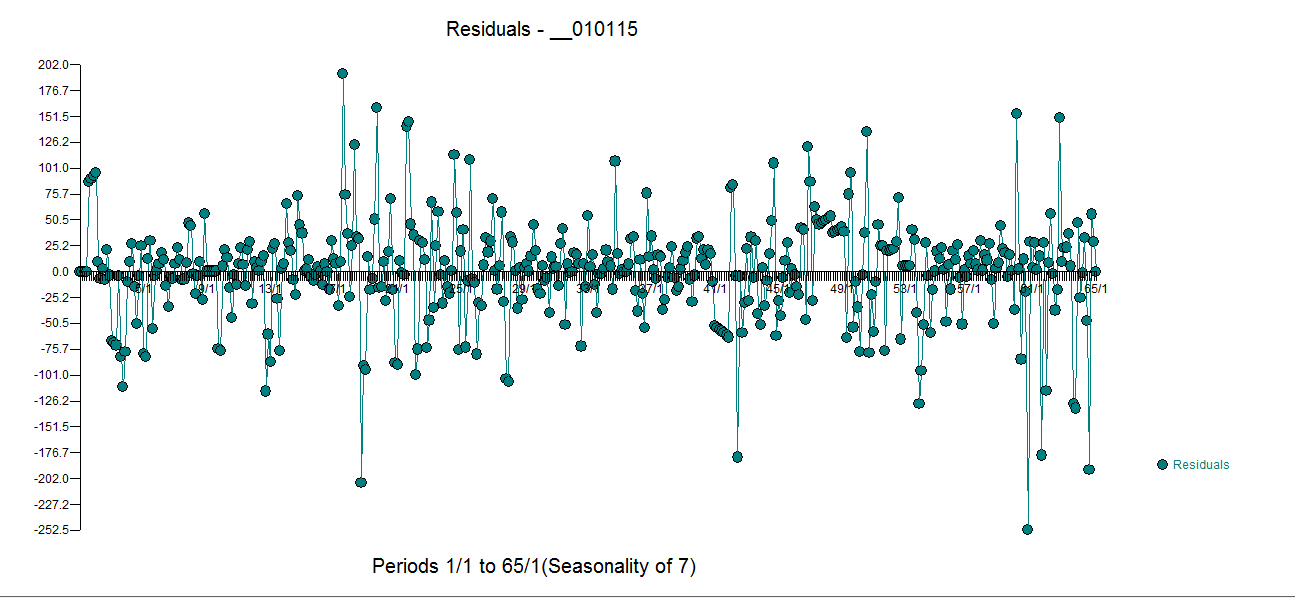
Here is a example of the data from one account.

