2
$\begingroup$

I work with Google Adwords. Recently Google has changed its layout regarding its ads. And I want to measure what was the impact of that change.

I don´t want to do a super analysis, but I would like to do more than just look at the chart and say: "this line goes up". I had an idea of how to measure that: however, I not very sure if it´s the correct way and if my reasoning makes sense.

We pay our ads on Google according to how many people click on the ads. It´s called CPC (cost per click). The ads appear on Google according to a bid: I compete against other people who also want to show their ads. Prior to the change in layout there were 10 spots to show ads; now there are 5.

My hypothesis is that, with fewer spots, there will be more people competing per spot, the bids will get higher and therefore my CPC will be higher.

I need to check if this is indeed the fact.

My idea is to get a time series, trace a tendency line and see the angle of this line. I have to do that for about 60 accounts. If most of the angles are positive I can deduce that the CPC has increased; if most have a angle close to zero or negative, I can deduce that there were no increases in CPC. I think I can also calculate the chi-square to see how relevant these results are.

Will this work? Is there a better way? Is it possible to do this with Excel or Google spreadsheet (preferably Google spreadsheet)?

Here is a example of the data from one account.

$\endgroup$
6
  • $\begingroup$ Your context suggests that you would have a break in mean in the CPC time series, whereas you say that you want to discover a break in trend. These are two different things, and you should be clear on which one you want. $\endgroup$ Commented Mar 24, 2016 at 19:40
  • $\begingroup$ Sorry for the ignorance. But could you explain the diference? $\endgroup$ Commented Mar 24, 2016 at 20:23
  • $\begingroup$ Everybody wants to do this (simply and probably incorrectly) . Detecting level shifts ( a form of change ) is important to your analysis. Detecting changes in trends ( a form of a change) is important to you. Both circumstances need to be robust to pulses or one-time anomalies and possible daily effects. All analyses need to be robust to the underlying auto-projective memory . Please post an example of one of your series and I will try and help. There is absolutely no quick/cheap/easy/basic/childlike procedure ... there is just a lot of deficient approaches BUT I will try and help. $\endgroup$
    – IrishStat
    Commented Mar 24, 2016 at 20:39
  • $\begingroup$ Here is a example from one account: docs.google.com/spreadsheets/d/… $\endgroup$ Commented Mar 25, 2016 at 1:06
  • 1
    $\begingroup$ When you state I din't want to do a "super analysis" you are implicitely asking for " a back of the envelope" quick'n dirty solution that is highly unlikely to be worth anything and will deliver on average a worthless result. There is no Santa Claus for you or this problem/opportunity just complexity and extracted/useful information gleaned from the data.. $\endgroup$
    – IrishStat
    Commented Mar 26, 2016 at 20:39

1 Answer 1

1
$\begingroup$

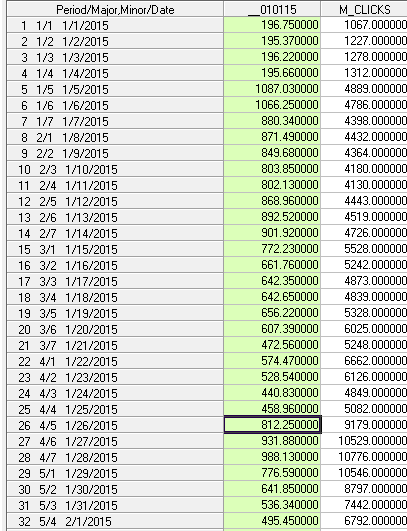
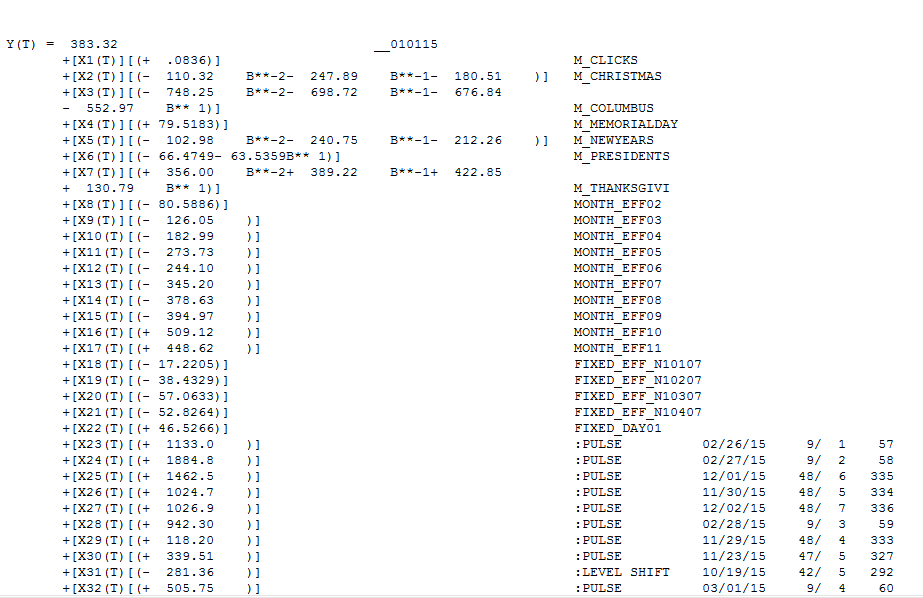
What you have is 449 daily values starting at 1/1/2015 for total cost(y) and # of clicks(x) . A simple approach which almost never works is to compute the ratio of y to x . Analysis of the ratio presumes a certain fixed model between y and x. A more general (less presumptive) is to examine the relationship between y and x . Now if the data is chronological/longitudinal/sequential then one needs to account for any time dependence. With your year and a half of data there is significant daily effects/monthly effects/holiday effects/first day of the month effects along with one-time unusual values. These need to be identified and incorporated into a model to determine the elasticity (response) of cost to clicks and if there were any level shifts and/or trends detectable. The conclusion is that there was a substantial/significant change/reduction in the level of cost at or around 10/19/15 and the overall marginal cost (response) was .0836 per click. This analysis may be worth what you paid for it but it reflects the best that I can do.

Following are some screen shots to aid the discussion . I used AUTOBOX a piece of software that I have helped develop but I am sure that you can find alternative software solutions.

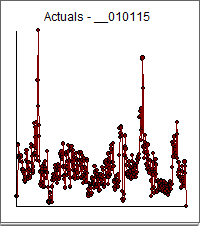
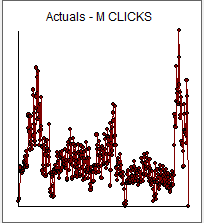
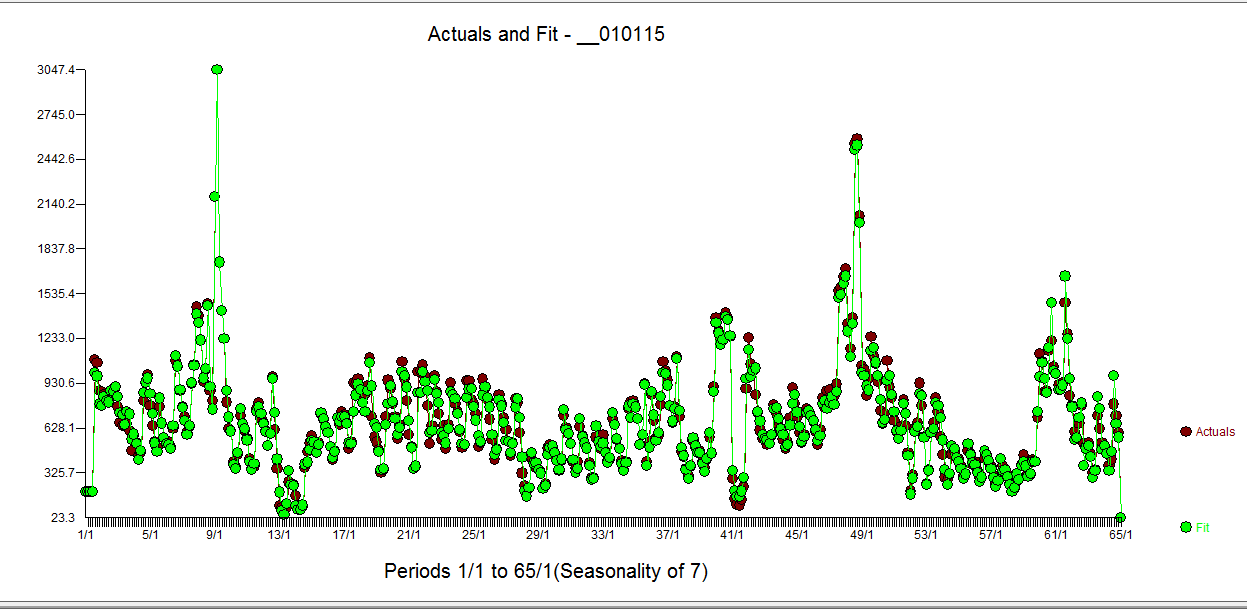
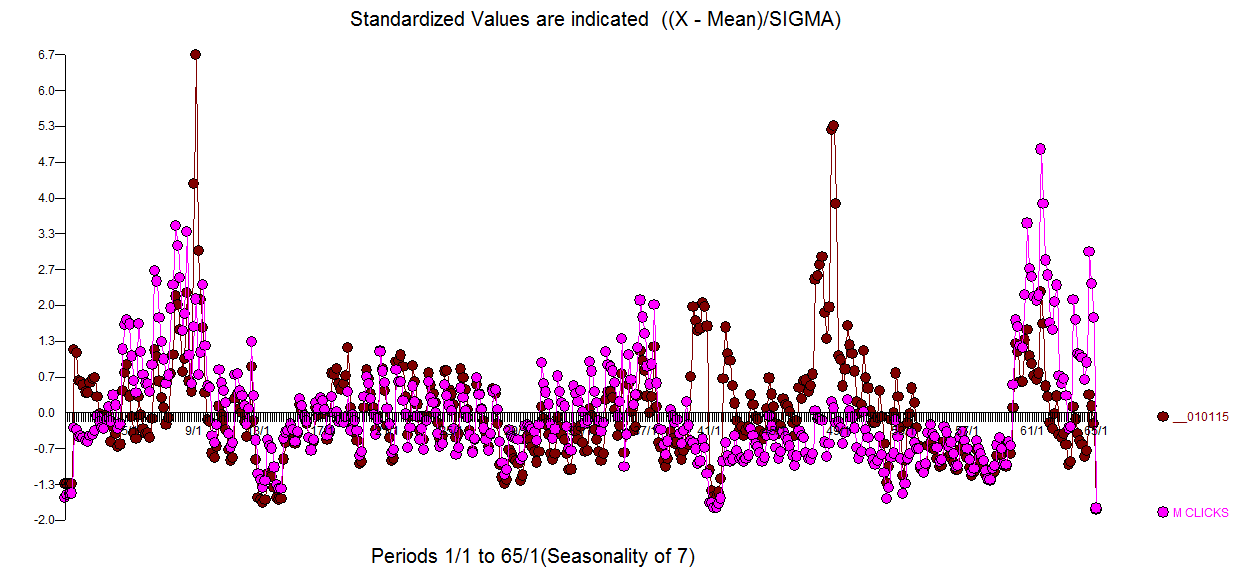
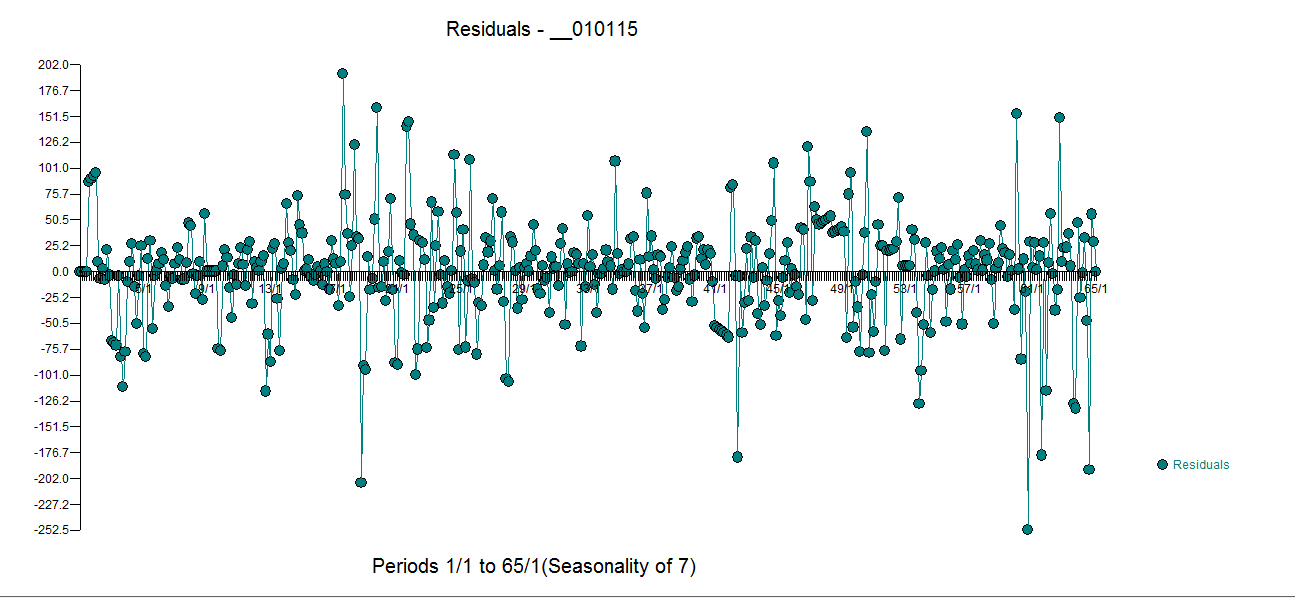
To begin with part of the data is presented here enter image description here with to separate plots of y and x ( cost and clicks) here enter image description here and enter image description here . The model that was developed is shown here in two images enter image description here and enter image description here . The efficacy of the model is shown in the actual/fit graph here enter image description here . Yet another visual showing both y and x together is here enter image description here . Finally the model residuals appear to be relatively stable ( without spurious over-fitting) enter image description here

In summary this is indeed very very far from computing simple ratios and endeavoring to fit splines in an attempt to conclude about significant increases or decreases. Sometimes the data is rich in structure(complications) . One of the side-effects of this analysis is that holidays have an important effect on the response of cost to clicks . Recall that all models are wrong BUT this one seems useful , at least to me !

$\endgroup$
2
  • $\begingroup$ what does **-2 mean, is it in the numerator or denominator? $\endgroup$
    – forecaster
    Commented Mar 25, 2016 at 22:27
  • $\begingroup$ This indicates the lead and/or lag indicator around a holiday . For example -102.98 is expected two days before New Years Day . The OP didn't say what country the data was collected in but I assumed the US. thus the standard US Holidays were investigated. These are the exponents of the B operator for numerator polynomials. $\endgroup$
    – IrishStat
    Commented Mar 26, 2016 at 0:37

Your Answer

By clicking “Post Your Answer”, you agree to our terms of service and acknowledge you have read our privacy policy.

Not the answer you're looking for? Browse other questions tagged or ask your own question.