1
$\begingroup$

I am doing an assignment for a Biostatistics course. We are asked very simple questions but there is one that seems strange to me. We have to plot the histogram of the blood pressure before and after a treatment. In the data-set we have both the treatment and the control group.

The question simply asks us the plot it, but does it make sense to include both the groups in the same histogram? How can we compare the "before" and "after" histogram this way?

$\endgroup$

2 Answers 2

2
$\begingroup$

It does make sense. Perhaps the blood pressure changes not because of treatment but because of something else (such as light, temperature, time since last meal, physical activity...). If this is the case, you should see a similar effect for both groups. If this is not the case, and treatment has an effect, you should only see the before-after difference for the treatment group while for the other group the histograms are broadly overlapping.

This is essentially differences-in-differences (DiD, double-dif) estimator, just presented in an informal and graphical way.

In case you are wondering how to create such a graph in a nice way, I would recommend you to ask another question (on StackOverflow) where you also mention which software do you use.

$\endgroup$
6
  • $\begingroup$ Thank you for your answer. Maybe I did not explain what we have to do clearly. Basically I will make two histograms: one for the "before" variable and one for the "after" variable (before taking a drug and after taking it, for instance). But in both the histograms I will have both the treatment and the control groups. I am not asked to make $4$ histograms: before/after treatment and before/after control. $\endgroup$
    – wrong_path
    Commented Oct 7, 2017 at 15:42
  • $\begingroup$ Good answer, but wrong signal on software. Software-specific questions are off-topic here. $\endgroup$
    – Nick Cox
    Commented Oct 7, 2017 at 15:42
  • 1
    $\begingroup$ So you are asked to do 2 histograms, both of which contain both groups? I don't see much use of it. It answers roughly the question: what is the average effect of the drug if only part of the population takes the drug, and there are no time trends otherwise. $\endgroup$
    – Ott Toomet
    Commented Oct 7, 2017 at 15:47
  • $\begingroup$ Exactly. This is why I am confused. The question explicitly says to compare the $2$ histograms. Thank you. $\endgroup$
    – wrong_path
    Commented Oct 7, 2017 at 15:49
  • 2
    $\begingroup$ Maybe it assumes these histograms keep the groups distinct? I am teacher myself and it is terribly easy to come up with confusing wording when creating problem sets... $\endgroup$
    – Ott Toomet
    Commented Oct 7, 2017 at 15:52
1
$\begingroup$

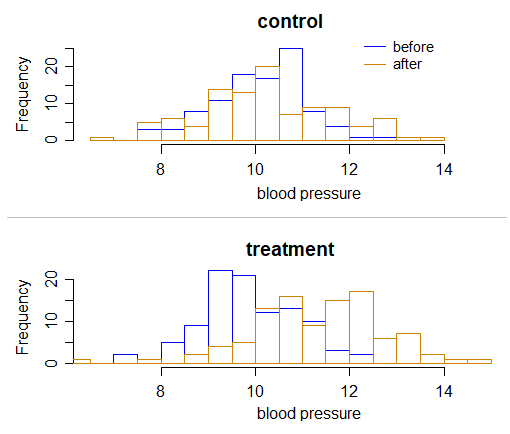
You can overlay histograms, or plot them back-to-back or one immediately under the other. So for example, if you overlay before and after for control and then do the same for treatment immediately under it, that would be one way.

pairs of before-after histograms, treat and control one under another

(You say in comments you're not asked to do 4 histograms, but in fact the way you phrase your question it seems like that is what you're asking.)

Personally, I'd be tempted to look at one histogram of after minus before for control and one for treatment but that doesn't sound like what you were asked for.

$\endgroup$

Your Answer

By clicking “Post Your Answer”, you agree to our terms of service and acknowledge you have read our privacy policy.

Not the answer you're looking for? Browse other questions tagged or ask your own question.