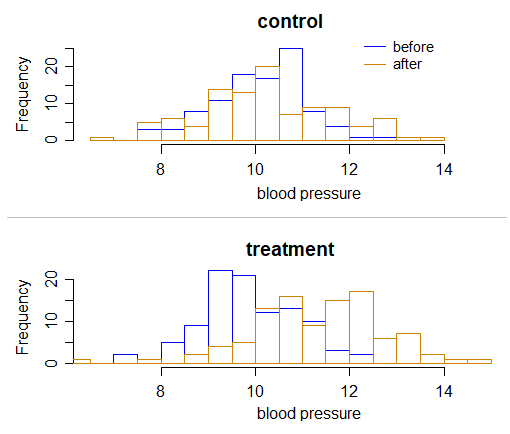
I am doing an assignment for a Biostatistics course. We are asked very simple questions but there is one that seems strange to me. We have to plot the histogram of the blood pressure before and after a treatment. In the data-set we have both the treatment and the control group.
The question simply asks us the plot it, but does it make sense to include both the groups in the same histogram? How can we compare the "before" and "after" histogram this way?

