-1
$\begingroup$

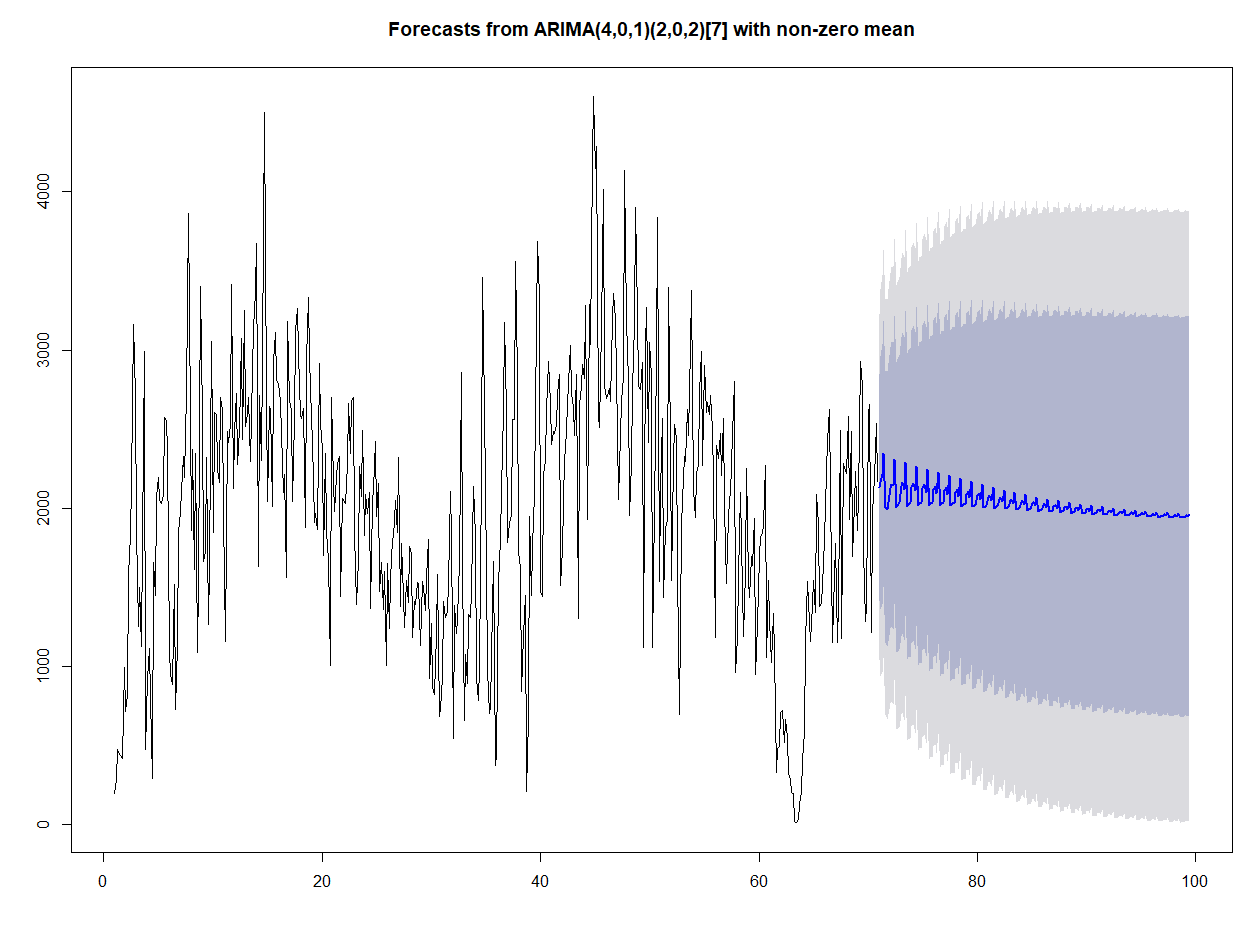
I obtained the ARIMA forcast below from the following code:

ARIMAfit = auto.arima((data.ts), seasonal = TRUE)
plot(residuals(ARIMAfit))
plot(forecast(ARIMAfit, h = 200))

where data.ts is a ts object with frequency 7 in R. The data set is the daily usage of bicycles in a bike-share program.

enter image description here

As you can imagine, I want a better forecast of what would happen. Do you have any suggestions on how to improve my forecast?

The data passes both the DF and DW tests after I apply the auto.arima.

I appreciate your help.

Data:

Time Series:
Start = c(1, 1)
End = c(9, 10)
Frequency = 60

197 284 471 446 436 415 995 713 819 1582 1828 2162 3159 2714 1854 1254 1497 1123 1809 2993 474 922 1115 797 293 1656 1449 2076 2192 2057 2032 2084 2572 2554 2368 1096 950 883 1515 730 1139 1844 1977 2113 2326 2197 2731 3864 3241 1856 2374 1612 2346 1085 1536 3400 2574 1663 1729 2320 1264 1631 3054 1849 2605 2593 2244 2161 2702 2622 1956 1157 2485 2416 2530 3417 2124 2483 2728 2274 2498 3073 2436 3249 2518 2601 2699 2298 2871 3138 3368 3675 1632 2715 2302 2981 4505 2702 2044 2642 2624 2009 2927 3111 2812 2789 2677 2475 2102 2214 1560 3182 2680 2618 2045 2564 3125 3262 2979 2589 2570 2633 1878 2938 3330 2951 2567 2420 1908 1969 1865 2916 2535 2371 1699 2347 1852 1667 1004 2701 2172 1981 2203 2284 2326 1439 2063 2042 2030 2278 2661 2348 2684 2703 1839 1392 1676 2261 2071 2489 1825 2084 1965 2098 1368 2037 2126 2422 1949 2154 1474 1655 1358 1602 1004 1650 1240 1556 1802 1817 2047 1846 2323 1380 1779 1441 1245 1540 1406 1756 1716 1185 1411 1391 1528 1526 1131 1538 1501 1352 1560 1802 922 1270 873 823 1205 1579 683 733 928 1413 1310 1349 1528 2103 1823 543 1385 1205 1305 1659 2858 1600 656 1078 893 1325 1306 1481 2137 1822 920 782 1000 2193 3459 2640 1603 982 703 741 1381 1664 373 434 1533 1803 2118 2611 3173 2610 1784 1902 1956 2561 2562 3558 2842 1726 1623 843 1194 1445 211 665 1947 1446 1756 2092 2630 3684 3330 1475 1439 2212 2303 2616 2926 2664 2403 2484 2471 2523 2721 2843 1513 1742 2318 2366 2647 2796 3028 2725 2635 2458 2846 1301 2655 2769 2910 2818 3285 1926 3286 3036 4193 4602 4147 4288 2588 2513 3150 4016 2774 2694 2706 2758 2677 3194 3361 3192 2485 2053 2468 2675 2835 4133 3184 2807 1954 2291 2752 3167 3903 3229 2777 2751 2923 1122 3005 3270 2418 3046 2830 1119 2000 2944 3836 1538 2105 2569 1436 1878 1921 3393 2426 1545 2292 2529 2441 1606 695 1881 2052 2328 2298 2625 2457 3022 3375 2118 1943 2218 2270 2733 2993 2273 2902 2605 2666 2591 2715 2500 2181 1180 2399 2313 2472 2210 2567 2007 1524 1764 2066 2088 2467 2803 963 1185 1572 2101 1781 1190 1595 2252 1547 1434 1696 1637 1935 947 1267 1704 1817 1846 1889 2270 1055 1544 1292 1027 1332 1084 328 479 490 710 722 521 665 552 324 282 201 197 16 14 31 129 202 405 590 1157 1534 1411 1159 1391 1542 1343 2087 1894 1377 1399 1646 1811 2224 2427 2622 2084 1151 1366 1778 1151 1408 2492 1175 2280 2256 2220 2581 1926 2487 1693 2022 2231 1858 2074 2925 2775 1731 1284 1376 2599 2658 1217 1965 2195 2538 2169

$\endgroup$
7
  • $\begingroup$ Post your data.Your data may have detreministic seasonalitywhich auto.arima can't identify. $\endgroup$
    – IrishStat
    Commented Nov 10, 2019 at 18:38
  • $\begingroup$ @IrishStat here it is! Thanks ^ $\endgroup$
    – Santi
    Commented Nov 11, 2019 at 22:05
  • $\begingroup$ I would remove "in R" from your question. If code in R is really your focus, then your question is arguably off-topic. $\endgroup$
    – Nick Cox
    Commented Nov 12, 2019 at 12:56
  • $\begingroup$ If you are happy with my answer please accept it to close the question $\endgroup$
    – IrishStat
    Commented Nov 22, 2019 at 21:41
  • $\begingroup$ How do I close it @irish $\endgroup$
    – Santi
    Commented Nov 22, 2019 at 22:47

1 Answer 1

1
$\begingroup$

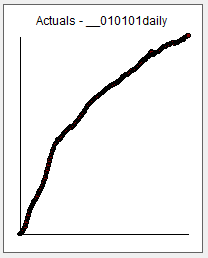
Your daily data is here enter image description here . This is a cumulative series which will have SIGNIFICANT autocorrelation due to the INDUCED structure as a result of your accumulation. Building an arima model for this is essentially attempting to reverse the user-driven autocorrelation to identify the fixed effects.

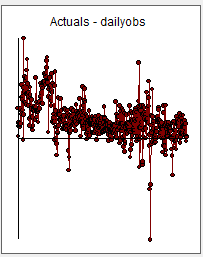
I took your cumulative and first differenced it to obtain what you observed i.e. daily realizations.

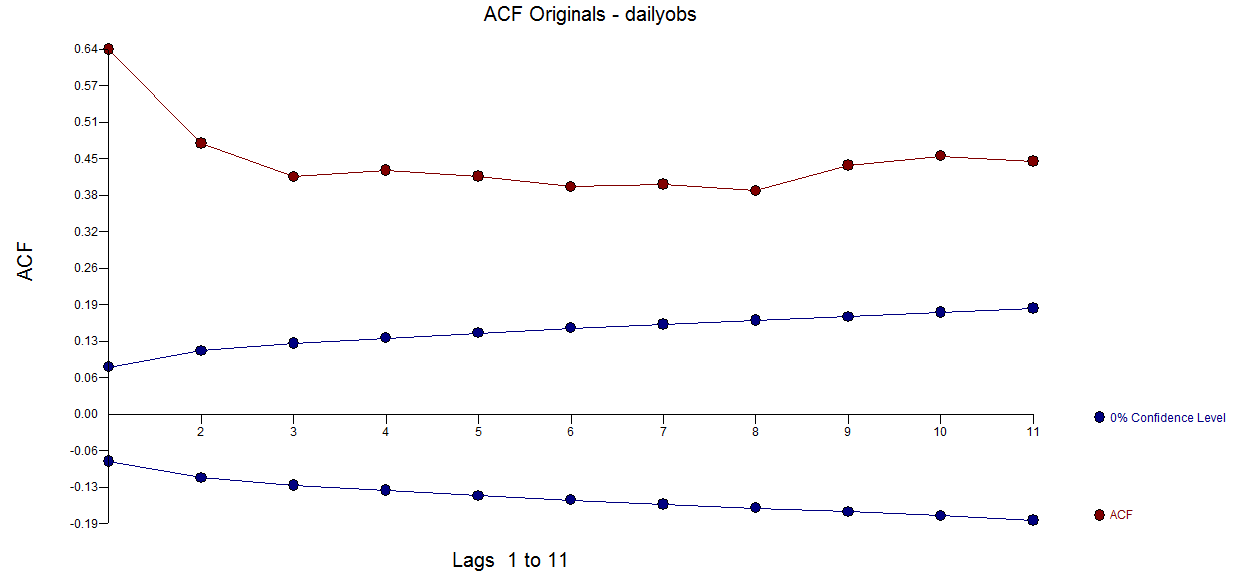
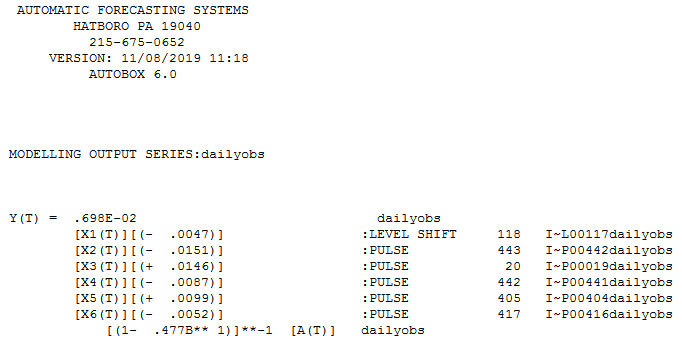
The correct thing to do is always analyze the observed daily series which is here enter image description here which has a level shift , five pulses and a model (1,0,0) based upon an acf of enter image description here .

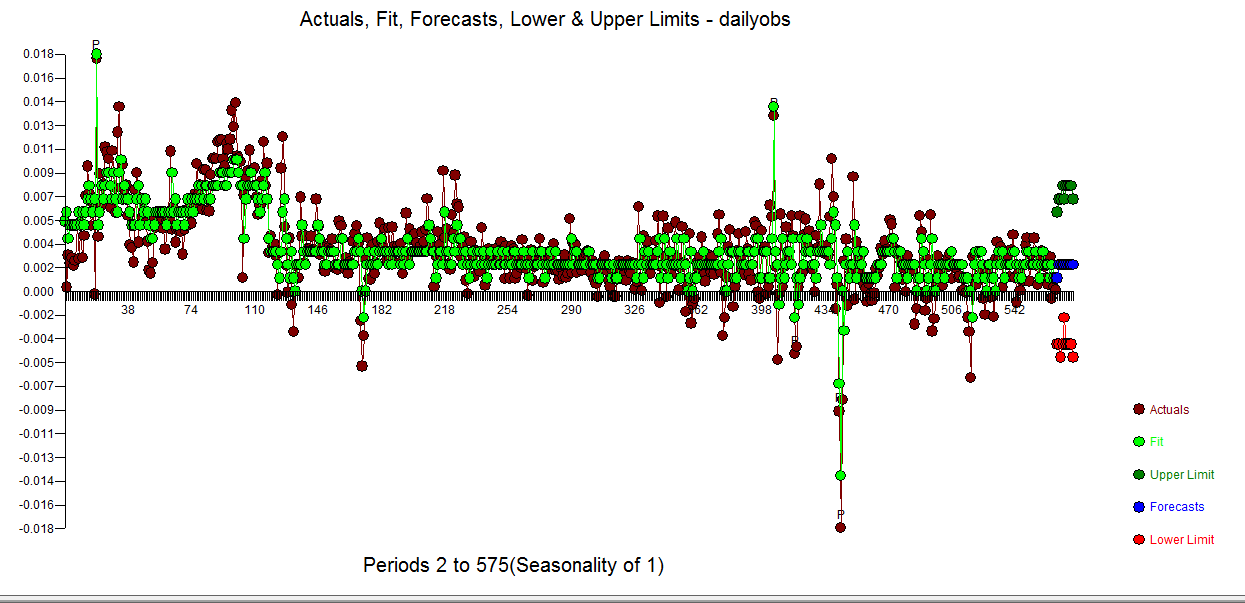
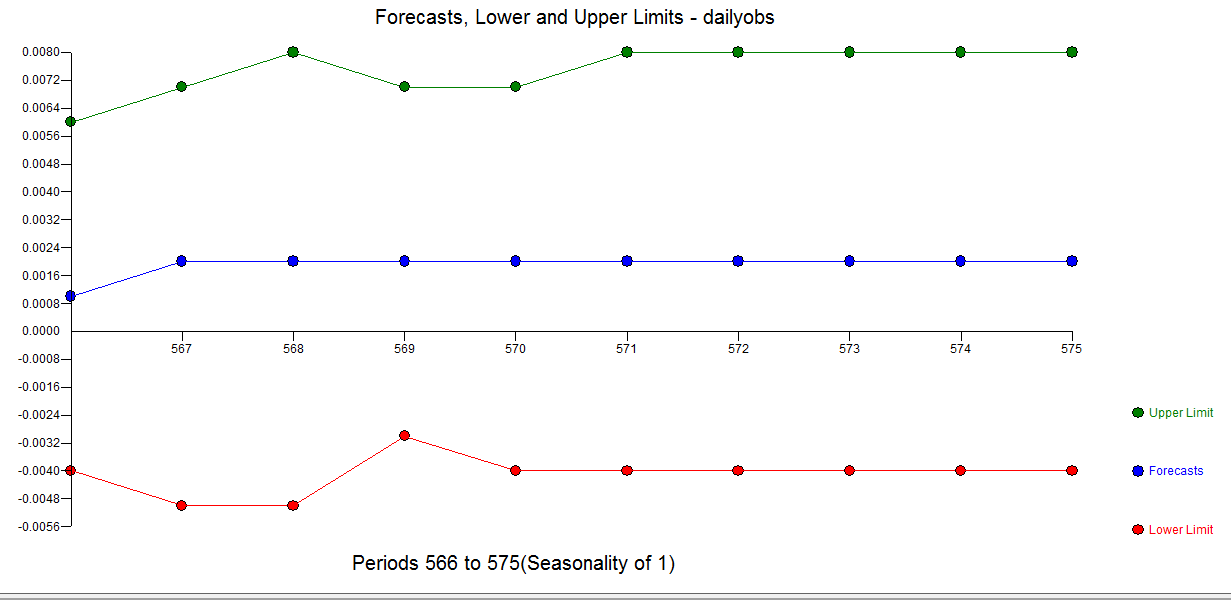
The Actual/Fit and Forecast for the observed series is hereenter image description here with forecasts here enter image description here

Now to forecast the cumulative simply take your last value and sequentially add each forecasted value sequentially to 4.6691 your last cumulative. Notice that my forecasts are upwards trending for the resultant cumulative while yours are flat.

The cumulative series is a derived series ( by addition) and will not provide the clarity that you need to analyze the observed daily series with whatever software that you have access to that identifies the arima model in the presence of a level shift and pulses SEE https://cran.r-project.org/web/packages/tsoutliers/tsoutliers.pdf for some guidance on detecting latent deterministic structure.

What you are doing is a typical mistake of transforming the observations i.e. filtering them and then trying to create a model for the artificially summed series.

Build an ARIMA model like this one enter image description here

$\endgroup$
12
  • 1
    $\begingroup$ Edited all mentions of "cumulant" to "cumulative", as "cumulant" has a specific statistical meaning not applicable here (cumulants are related to moments). $\endgroup$
    – Nick Cox
    Commented Nov 12, 2019 at 12:59
  • $\begingroup$ tu ... as usual we are two countries separated by a common language. $\endgroup$
    – IrishStat
    Commented Nov 12, 2019 at 13:15
  • 1
    $\begingroup$ The term cumulant was suggested by Harold Hotelling, a US citizen. See en.wikipedia.org/wiki/Cumulant Hence I don't think this has anything to do with American English and British English. It's all to do with avoiding a term which does not have the meaning you intend in favour of a more common word which does. $\endgroup$
    – Nick Cox
    Commented Nov 12, 2019 at 13:22
  • $\begingroup$ My own guess is that substantive information is needed for a better, or even a good, model. For example, a very wild guess: does participation involve monthly payments or sign-ups, or otherwise why does there appear to be a monthly cycle (pun not intended)? $\endgroup$
    – Nick Cox
    Commented Nov 12, 2019 at 14:20
  • $\begingroup$ with 20 months, I am usually reticent/reluctant to declare/test for monthly effects $\endgroup$
    – IrishStat
    Commented Nov 12, 2019 at 17:17

Your Answer

By clicking “Post Your Answer”, you agree to our terms of service and acknowledge you have read our privacy policy.

Not the answer you're looking for? Browse other questions tagged or ask your own question.