0
$\begingroup$

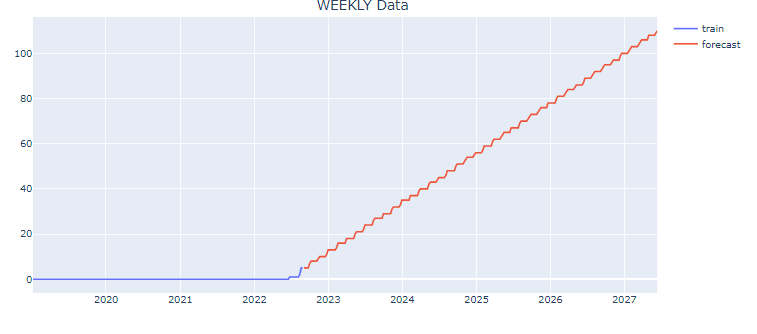
I have below output from AUTO ARIMA model. I do think the output is justified, but the model is considering only the recent change in input and giving the same trend as output. I have to use a generic AUTO ARIMA model which does 10+ time series forecast. How to handle input such as below?

enter image description here

Input data: from 01-01-2019 to 31-08-2022. Daily data resampled to weeks.. values are 0,0,0... until last 5 training data which are 1,1,2,5 and 5

$\endgroup$
2
  • $\begingroup$ added the input data $\endgroup$
    – Shravan K
    Commented Sep 7, 2022 at 9:39
  • 2
    $\begingroup$ You've given us nothing. $\endgroup$ Commented Sep 7, 2022 at 9:47

2 Answers 2

3
$\begingroup$

Your data is three years of data that is all zeros and five recent weeks with non-zero values. With such data, you don't have much ground for reasonable forecasting. It's not surprising that auto-arima fails. Given the long history of "no signal" predicting zero would be a quite reasonable forecast. Since the data is limited, you could check the Best method for short time-series thread, which suggests using very simple models in such cases (e.g. historical average, which in your case would again be close to zero).

Second, an important question to ask yourself is what has changed during the last five weeks? There seems to be a significant change in the data. Is the historical data relevant to the problem at all? If yes, you should probably predict something like zero. If not, you probably should ignore it. This is a question to ask yourself or a domain expert in your area.

$\endgroup$
1
  • $\begingroup$ Fair enough.. i thought so too.. but had hope there will be a way to handle this scenario in AUTO-ARIMA. Thank you for the answer $\endgroup$
    – Shravan K
    Commented Sep 7, 2022 at 10:55
0
$\begingroup$

There is a way to perform a restricted search of the parameters of ARIMA in autoarima, as it is a very short time series the data you have, I would only grid on AR - MA parameter from the model that is (p,q).

So by editing the ranges of p and q (max and min) you would improve the results by having a more reasonable result. In order to decide aproximated ranges you can use acf and pacf plots.

auto.arima(
  y,
  d = NA,
  D = NA,
  max.p = 5,
  max.q = 5,
  ...

For more info, please see documentation at: https://pkg.robjhyndman.com/forecast/reference/auto.arima.html

please note that ARIMA/ARMA is a generalization of a regression so similar to classic methods like moving average can be leveraged.

$\endgroup$

Your Answer

By clicking “Post Your Answer”, you agree to our terms of service and acknowledge you have read our privacy policy.

Not the answer you're looking for? Browse other questions tagged or ask your own question.