1
$\begingroup$

I am trying to decide whether a poisson or negative binomial GLM is the better model for analysing my data. The models being:

mal_NB <- glm.nb(own_stability ~ own_treatment +
                          partner_treatment,
                        data = compiled_mal_2, link = log)
mal_poisson <- glm(own_stability ~ own_treatment +
                     partner_treatment,
                   family = poisson(link = "log"), data = compiled_mal_2)

I have two main questions, firstly, can I use a likelihood ratio test to compare the two (i.e. the lrtest() function in R. Secondly, how do I interpret the output (see below) of this test?

> lrtest(mal_poisson, mal_NB)
Likelihood ratio test

Model 1: own_stability ~ own_treatment + partner_treatment
Model 2: own_stability ~ own_treatment + partner_treatment
  #Df  LogLik Df  Chisq Pr(>Chisq)    
1   5 -365.02                         
2   6 -152.30  1 425.42  < 2.2e-16 ***
---
Signif. codes:  0 ‘***’ 0.001 ‘**’ 0.01 ‘*’ 0.05 ‘.’ 0.1 ‘ ’ 1

** from the comments: Dispersion coefficients of both models are 0.83 or 1.34 and 16.37 or 15.81 (via two different methods) for negative binomial and poisson models, respectively. The AIC of poisson model = 740 and negative binomial model = 316 **

Residual plot for a negative binomial GLM residual plot NB
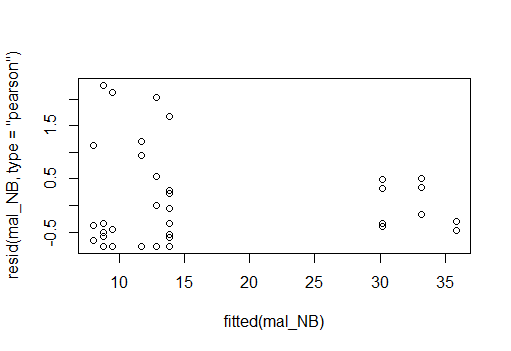
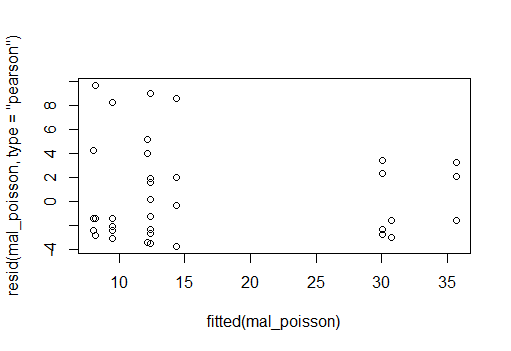
And residual plot for a poisson GLM, neither looks great (poisson maybe a little better) residual plot poisson
$\endgroup$

1 Answer 1

3
$\begingroup$

You could use a likelihood ratio test but to decide with distribution to choose, you should do some model validation steps first, i.e. checking residuals for any patterns that would indicate the distributional fit is appropriate (or not) as well as checking your models for overdispersion.

Model comparisons as you performed via the Likelihood ratio test are more common to decide which fixed effect combinations can explain the data best. The output of the test suggests that your second model (negative binomial) explains the data better and hence is a significantly better fit (as indicated by the p-value).

Check the documentation for the countreg R package here: https://cran.r-project.org/web/packages/pscl/vignettes/countreg.pdf as well as for rootograms: https://arxiv.org/pdf/1605.01311.pdf

Also there are also quite a few answers on model selection and Poisson/negative binomial here on Cross Validated, e.g. https://stats.stackexchange.com/a/325431/32477

$\endgroup$
6
  • $\begingroup$ Thank you for your response Stefan! I have analysed the dispersion coefficient of both models and found that of the negative binomial model to be 0.83 or 1.34, while that of the poisson model is 16.37 or 15.81 (via two different methods). Further, the AIC of the two models is 740 and 316 for the poisson and negative binomial model, respectively. I wasn't sure which residuals to check (and against what), but I'll check out the ones in the link you attached, though are these checks only relevant to poisson GLMs or also negative binomial GLMs? $\endgroup$
    – Tobit
    Commented Dec 16, 2019 at 11:31
  • $\begingroup$ It seems like that the negative binomial model is more appropriate - but it's very difficult to judge without seeing the data. I am guessing you have too many zeros? Another option you might want to look at are zero-inflated and hurdle models. See here: cran.r-project.org/web/packages/pscl/vignettes/countreg.pdf The pscl package also contains diagnostics to check for model fit etc. Good luck! P.S. If you found this answer useful please consider accepting it. $\endgroup$
    – Stefan
    Commented Dec 16, 2019 at 20:40
  • $\begingroup$ Sadly I can't share the data, what aspect would you need to see? Yes I have a lot of zeros, however these are all 'true' zeros, meaning that zero-inflated models that assume different causes of zeros and positive integers are, to my knowledge, inappropriate. I could not find any diagnostics in the pscl package? I found the odTest function that essentially tests whether a NB is better than a poisson model on the grounds of dispersion (could just compare dispersion coefficients instead?) $\endgroup$
    – Tobit
    Commented Dec 18, 2019 at 10:21
  • $\begingroup$ What you need to figure out is whether the negative binomial model accounts for the extra zeros (i.e. zeros that cannot be accounted for by using a Poisson model) - and it might, judging by the dispersion coefficient. What I was referring to and what I thought was explained in the paper are rootograms. But those are explained in a separate paper: arxiv.org/pdf/1605.01311.pdf $\endgroup$
    – Stefan
    Commented Dec 18, 2019 at 14:15
  • $\begingroup$ General residual checks can be done in this way: plot(resid(mymodelfit, type = "pearson") ~ fitted(mymodelfit). Another option for checking residuals would be the DHARMa package: cran.r-project.org/web/packages/DHARMa/vignettes/DHARMa.html $\endgroup$
    – Stefan
    Commented Dec 18, 2019 at 14:15

Your Answer

By clicking “Post Your Answer”, you agree to our terms of service and acknowledge you have read our privacy policy.

Not the answer you're looking for? Browse other questions tagged or ask your own question.