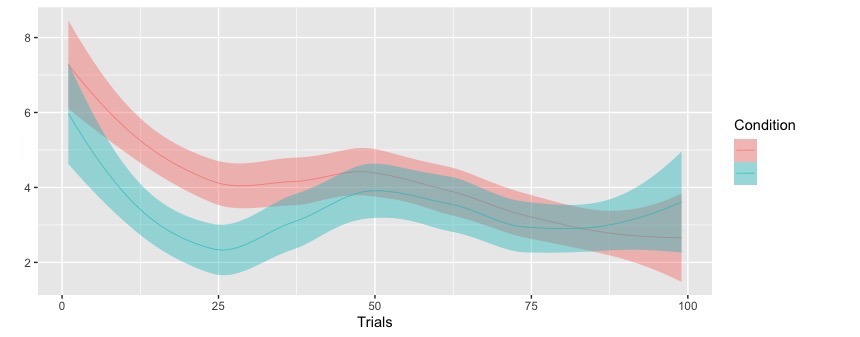
I don't think a linear model would fit this? This is a change in the 'dependent' variable over trials in two conditions. The hypothesis is that over trials the dependent variable reaches a tabletop/plateau. My model assumes a plateau. But how do I show that my data follows this? Would you say that this is 'mostly' non-linear model?
$\begingroup$
$\endgroup$
11
-
2$\begingroup$ You talk about a model that assumes a plateau. However you ask for a good model ? Please clarify your question / problem. What do you actually want to know ? $\endgroup$– RodolpheCommented Jun 2, 2020 at 19:49
-
2$\begingroup$ If you want suggestions for a model that matches data, you need to show data (and explain what the data are). How large a sample size does your graph show? $\endgroup$– Harvey MotulskyCommented Jun 2, 2020 at 20:14
-
$\begingroup$ @HarveyMotulsky in both conditions it's 30 people each. This what you see is my plotted data. My hypothesis is that the data over trails converge to a tabletop/plateau in both conditions. How do I test this hypothesis for data converging to a tabletop.Plus the plotted data doesn't look like a linear model. $\endgroup$– amarykya_ishtmellaCommented Jun 2, 2020 at 22:05
-
$\begingroup$ @Rodolphe I'm asking wrt to whether should I use a linear regression for this hypothesis testing? $\endgroup$– amarykya_ishtmellaCommented Jun 2, 2020 at 22:08
-
$\begingroup$ Thanks for your answers. Maybe try to think differently. Could you state formally the definition of what is a plateau ? Then how to see if your data becomes more like your definition, towards the last trials than at the beginning (maybe using a sliding window of trials) ? $\endgroup$– RodolpheCommented Jun 3, 2020 at 0:32
|
Show 6 more comments

