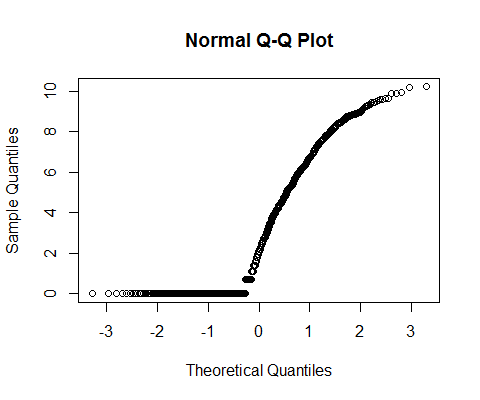
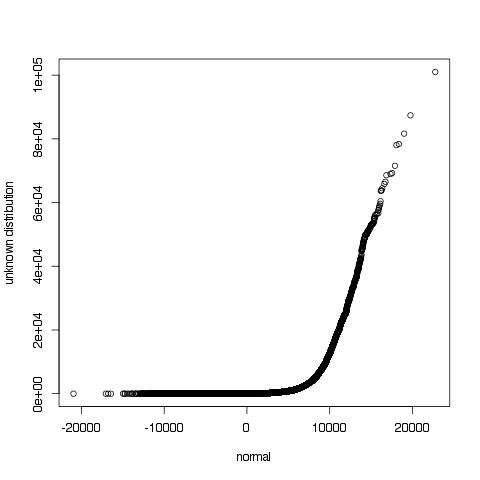
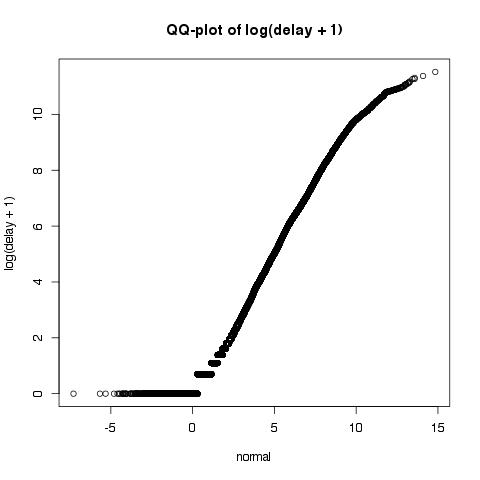
Taking your second Q-Q plot, it gives us some clues - if it were lognormal, the upper right part would look straight.
So that suggests that perhaps it's something lighter-tailed than lognormal, at least for the larger values.
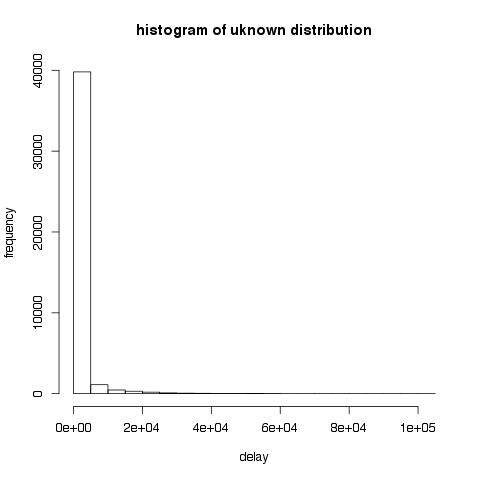
A right-skew distribution that's lighter-tailed than lognormal is the gamma. It seems pretty skew - substantially more skew than an exponential for example, so it suggests a shape parameter smaller than 1.
Here's an example:
x=c(rgamma(1000,.1,1/9000))
x1=round(x);qqnorm(log(1+x1))

However, it's difficult to get the shape of the Q-Q plot quite right; one possibility is that a mixture of two gammas might do better.
Another thing to consider is shifted gamma distributions - adding something like 0.4 before rounding does seem to improve the shape at the low end.
Experiments with mixtures does suggest that a finite mixture with a few components might do quite well, so it's probably worth trying a 2 or 3 component mixture of gammas or shifted gammas (or indeed similar less-skew-than-lognormal distributions) and using a decent fitting algorithm, rather than the bit of trial and error I used to get this far.


