5
$\begingroup$

I'm wondering how to proceed to perform Canonical Correspondence Analysis and Multiple Correspondence Analysis in R on the following three-way contingency table

Eco_region3  Eco_region4  Species Freq
    A           A1          S1      10
    A           A1          S2      12
    A           A1          S3       8
    A           A2          S1      10
    A           A2          S2       6
    A           A2          S3      11
    A           A3          S1       2
    A           A3          S2       9
    A           A3          S3      13

    B           B1          S1      13
    B           B1          S2      15
    B           B1          S3       7
    B           B2          S1       9
    B           B2          S2       8
    B           B2          S3      13
    B           B3          S1      15
    B           B3          S2      12
    B           B3          S3      13

    C           C1          S1      12
    C           C1          S2      18
    C           C1          S3      20
    C           C2          S1      12
    C           C2          S2       0
    C           C2          S3      11
    C           C3          S1      18
    C           C3          S2      10
    C           C3          S3      16

Eco_region4 is nested within Eco_region3.

Thanks

$\endgroup$

2 Answers 2

3
$\begingroup$

assuming your data are in a data.frame called dt, you can turn it into a table object using xtabs

tbl <- xtabs(Freq ~ Species + Eco_region4, data=dt)
tbl
          Eco_region4
   Species A1 A2 A3 B1 B2 B3 C1 C2 C3
        S1 10 10  2 13  9 15 12 12 18
        S2 12  6  9 15  8 12 18  0 10
        S3  8 11 13  7 13 13 20 11 16

You can get a three dimensional table by adding Eco_region3 to the end of the formula, but then the correspondence analysis would fail because of the nested structure of your data.

You can perform correspondence analysis with the ca function from the ca package.

$\endgroup$
0
$\begingroup$

This is an old question, but here are my two cents.

You can preform a Multiple Correspondance Analysis on this data rather easily. MCA is based on calculating a burt table on the qualitative variables and weighting them by the frequencies. A package in ade4 will do this for you automatically, but it's simple to reproduce.

In code

library(ade4)
df # your data as df

# create a burt table with the correct weight
df.disjonctif = acm.disjonctif(df[1:3]) * df[,4]

# result of the Multiple Correspondance Analysis
df.acm = dudi.acm(df.disjonctif, row.w = df[,4])

Granted, with MCA, visualization and interpretation become more complicated. There are three functions within the ade4 package that help to interpret the results.

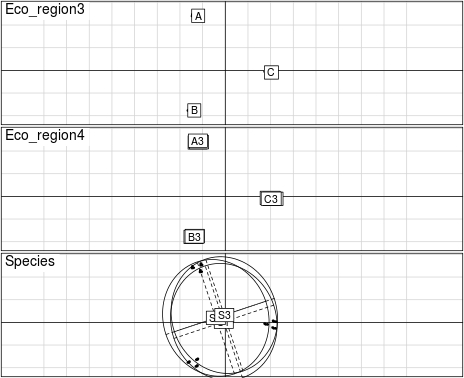
scatter(df.acm)
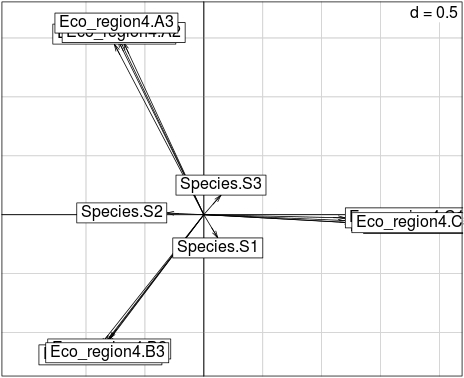
s.arrow(df.acm$co)
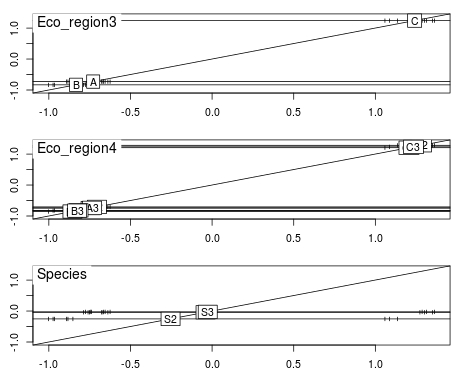
score.acm(df.acm)

Scatter will plot all of the points based on each qualitative variable, s.arrow will plot only the center of gravity for each combination of the qualitative variables, and score.acm will plot all of the variables on one axe.

Scatter

S Arrow

Score ACM on the first axe

$\endgroup$

Your Answer

By clicking “Post Your Answer”, you agree to our terms of service and acknowledge you have read our privacy policy.

Not the answer you're looking for? Browse other questions tagged or ask your own question.