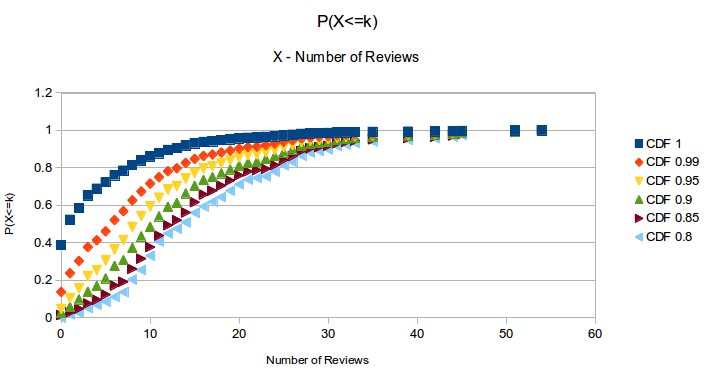
I've collected data from my website. The website is about cars. The data are about user reviews and the cars. what we see in the graphs is the probability of some car type (Ford Focus 2008) to have X reviews.
The interesting thing is that when I limit the types of cars to a certain % of the cars population, the distribution looks like the Poisson distribution.
To be clear about it:
100% of cars on roads are made of 850 car types (Israel)
99% of cars are only made of 360 car types
95% are 256,
and so on.
These are the relevant graphs:
You can see the at 80% it looks like Normal Distribution, as expected from high values of Poisson.
It looks exactly like the behavior of the Poisson distribution. Why is it, and what is the meaning of lambda (the distribution parameter) here?


