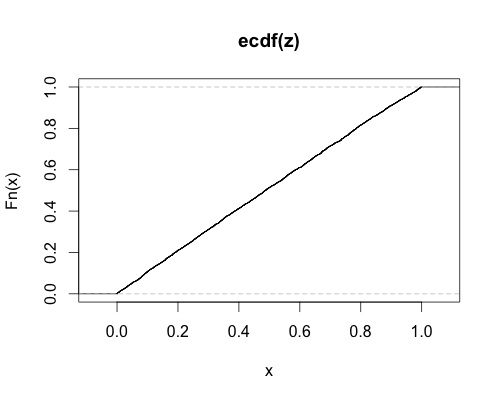
I confirmed @caracal's answer with a Monte Carlo experiment. I generated random instances from a linear model (with the size random), computed the F-statistic and computed the p-value using the non-centrality parameter
$$
\delta^2 = \frac{\Vert X\beta_1 - X\beta_2\Vert^2}{\sigma^2},
$$
Then I plotted the empirical cdf of these p-values. If the non-centrality parameter (and the code!) is correct, I should get a near uniform cdf, which is the case:

Here is the R code (pardon the style, I'm still learning):
# sum of squares
sum2 <- function(x) { return(sum(x * x)) }
# random integer between n and 2n
rint <- function(n) { return(ceiling(runif(1,min=n,max=2*n))) }
# generate random instance from linear model plus noise.
# n observations of p2 vector
# regress against all variables and against a subset of p1 of them
# compute the F-statistic for the test of the p2-p1 marginal variables
# compute the p-value under the putative non-centrality parameter
gend <- function(n, p1, p2, sig = 1) {
 beta2 <- matrix(rnorm(p2, sd=0.1), nrow=p2)
 beta1 <- matrix(beta2[1:p1], nrow=p1)
 X <- matrix(rnorm(n*p2), nrow=n, ncol=p2)
 yt1 <- X[,1:p1] %*% beta1
 yt2 <- X %*% beta2
 y <- yt2 + matrix(rnorm(n, mean=0, sd=sig), nrow=n)
 ncp <- (sum2(yt2 - yt1)) / (sig ** 2)
 bhat2 <- lm(y ~ X - 1)
 bhat1 <- lm(y ~ X[,1:p1] - 1)
 SSE1 <- sum2(bhat1$residual)
 SSE2 <- sum2(bhat2$residual)
 df1 <- bhat1$df.residual
 df2 <- bhat2$df.residual
 Fstat <- ((SSE1 - SSE2) / (df1 - df2)) / (SSE2 / bhat2$df.residual)
 pval <- pf(Fstat, df=df1-df2, df2=df2, ncp=ncp)
 return(pval)
}
# call the above function, but randomize the problem size (within reason)
genr <- function(n, p1, p2, sig=1) {
 use.p1 <- rint(p1)
 use.p2 <- use.p1 + rint(p2 - p1)
 return(gend(n=rint(n), p1=use.p1, p2=use.p2, sig=sig+runif(1)))
}
ntrial <- 4096
ssize <- 256
z <- replicate(ntrial, genr(ssize, p1=4, p2=10))
plot(ecdf(z))

