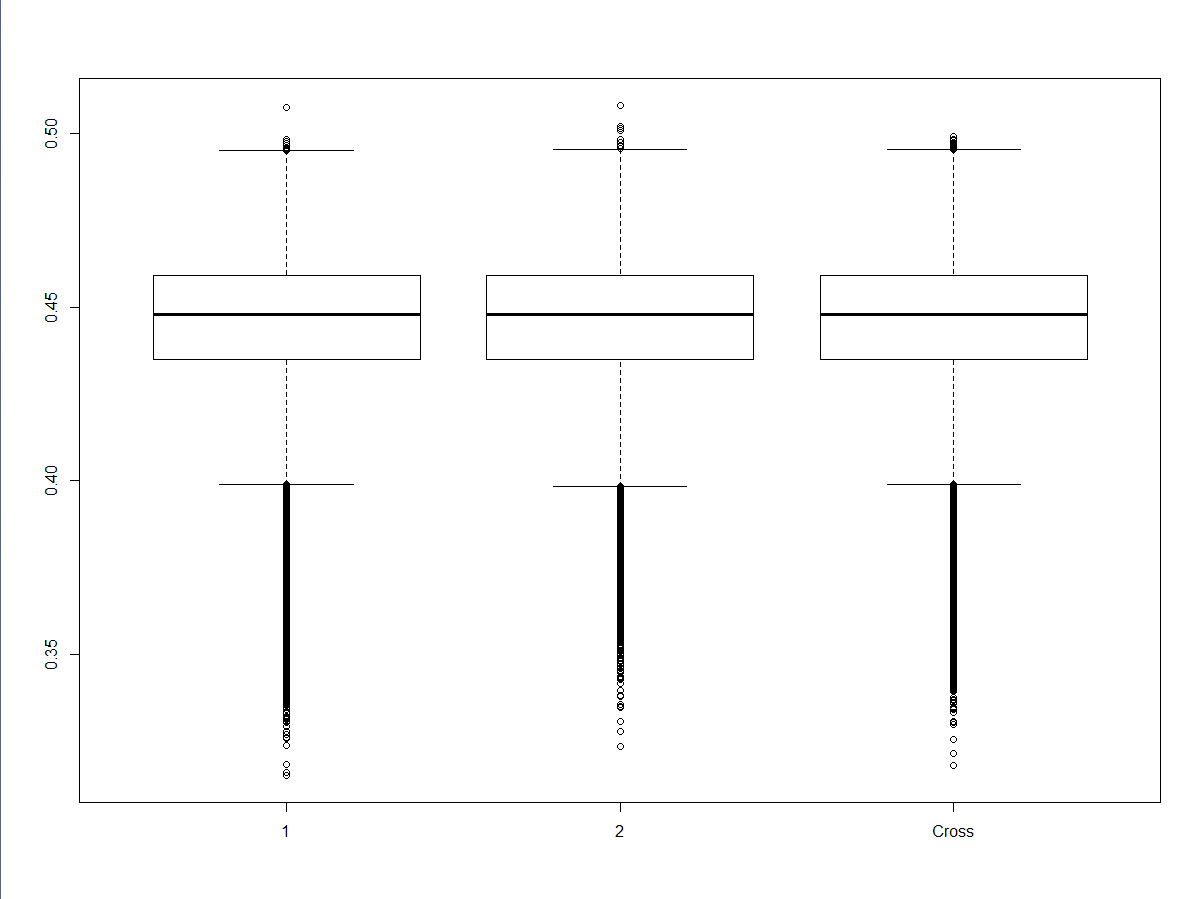
I have some data (called egecNonmated) in R and I am trying to show that the distributions of a variable (MatchScore) are identical across three different Categories (Cat). I am using a box plot to do this visually but it has been suggested (wisely) that I also show this quantitatively. Below is the R code I am running to do the visual analysis:
allNm <- boxplot(MatchScore~Cat, data=egecNonmated)
Showing "allNm" produces the following graph:

Viewing the statistics associated with the boxplot via
allNm$stats
Produces the following:
          [,1]      [,2]      [,3]
[1,] 0.3988655 0.3982853 0.3988191
[2,] 0.4349543 0.4347747 0.4349721
[3,] 0.4478581 0.4478713 0.4479012
[4,] 0.4590152 0.4591016 0.4590747
[5,] 0.4951032 0.4953164 0.4952006
We can see that the median score [3,] for each of the categories is identical to three decimal places. As are all the other statistics (lower whisker [1,], lower hinge [2,], upper hinge [4,] and upper whisker [5,]. So I would expect kruskal wallis to accept the null hypotheis that the three distributions are from identical populations. However when I run
kruskal.test(MatchScore ~ Cat, data=egecNonmated)
I get the following:
Kruskal-Wallis chi-squared = 15.5941, df = 2, p-value = 0.0004109
If I am interpreting this correctly tells me that at a p value of 0.01 I should reject the null hypothesis and therefore these distributions are NOT identical. Am I using the wrong test? Wrong interpretation? Thanks in advance for the help
