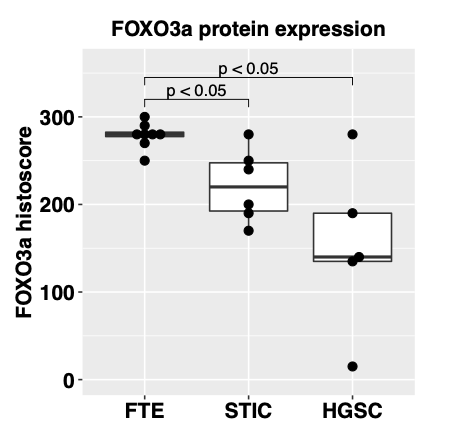
I created the following plot in R (ggplot2). But I don't know how to interpret the third boxplot. From the documentation: 'The upper whisker extends from the hinge to the largest value no further than 1.5 * IQR from the hinge (where IQR is the inter-quartile range, or distance between the first and third quartiles)'. However, the plot does not show any whisker up to the largest value or 1.5 * the IQR. Why not?
1 Answer
Note that the middle boxplot does show upper and lower whiskers.
Note that whiskers extend from the box to specific values, namely, for the upper whisker, "the largest value no further than 1.5 * IQR from the hinge", and analogously for the lower whisker. It is implicit in this definition that values that fall inside the box are not considered.
For instance, the boxplot on the right seems to describe only five data points. The box extends from the second-smallest (the first quartile) to the second-largest one (the third quartile). This only leaves the largest and the smallest value as potential candidates to extend the whiskers to. But apparently, they are both farther than 1.5 IQR away from the hinge, so they are considered outliers. Thus, there are no values to extend the whiskers to. Consequently, no whiskers are drawn.
The boxplot on the left apparently has identical first and the third quartiles, so the IQR is zero. In such a situation, no value will be outside the box and less than 1.5 IQR away from the hinge (because 1.5 IQR is also zero), so again, no value qualifies as the endpoint of a whisker, and no whisker is drawn.

