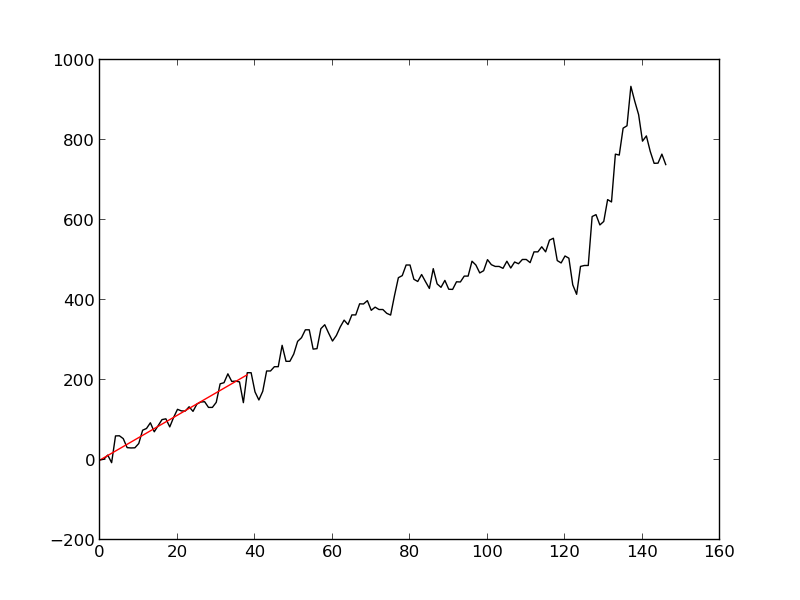
I have a time series that looks like this:
This comes from an experiment, and I know the following:
Originally, for $t < s$ the time series is $x_t = vt + e_i$, where $v$ for this particular case looks to be about 5.5, and $e_i \sim \mathcal{N} (0, \sigma_{early} )$. That is, it's directed motion with some white noise on top.
After a certain point, for $t > s$, the time series become a random walk: $x_t \sim \mathcal{N}(x_{t-1}, \sigma_{late})$
From knowing my system, I can put rough bounds on $\sigma_{early}, \sigma_{late}, v$ and I know for certain that $ \sigma_{late} > \sigma_{early} $. I model the latter fact by defining $\sigma_{late} = K\sigma_{early}$ where $K > 1$.
I would like to find $s$, the switchpoint, and $v$, the velocity. My first thought was to use pymc. Here's my code:
s = DiscreteUniform('s', 0, len(data))

v = Uniform('v', 1,8) # Picked this range by eye

@stochastic
def early_std(value = 1.0):
    if value < 0:
            return -np.inf
    else:
            return -np.log(value)

@stochastic(plot = False)
def K(value = 1.0):
    if value < 1:
            return -np.inf
    else:
            return -np.log(value)

@deterministic
def late_std(e_std= early_std, K = K):
    return e_std*K

@observed
def obs(value = data, e_std = early_std, l_std = late_std, v = v, s = s):
    early = np.sum( normal_like(value[i], v*i, e_std**-2) for i in range(s) )
    late = np.sum( normal_like(value[i], value[i-1], l_std**-2) for i in range(len(data))[s:] )
    return early + late
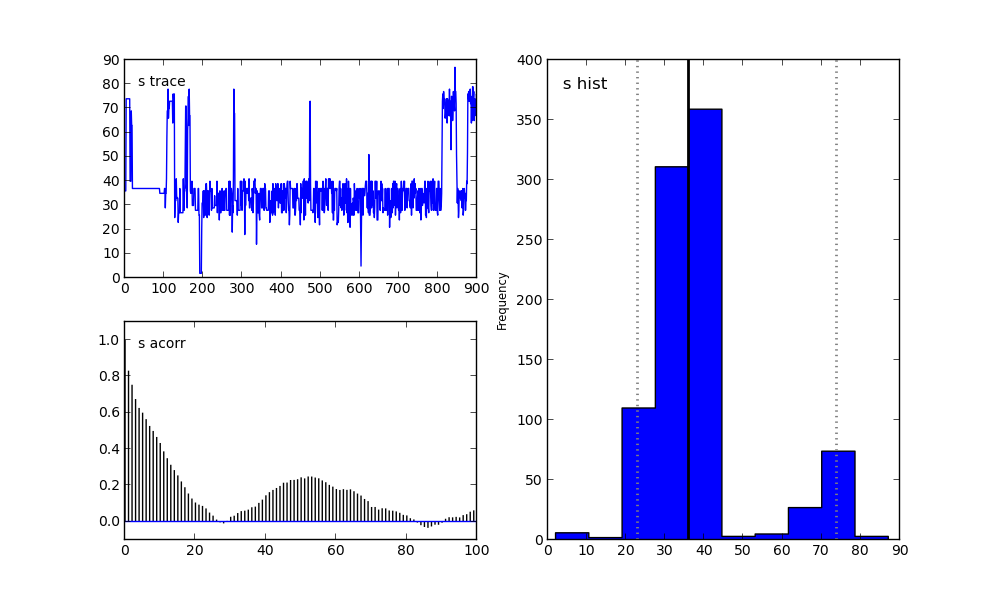
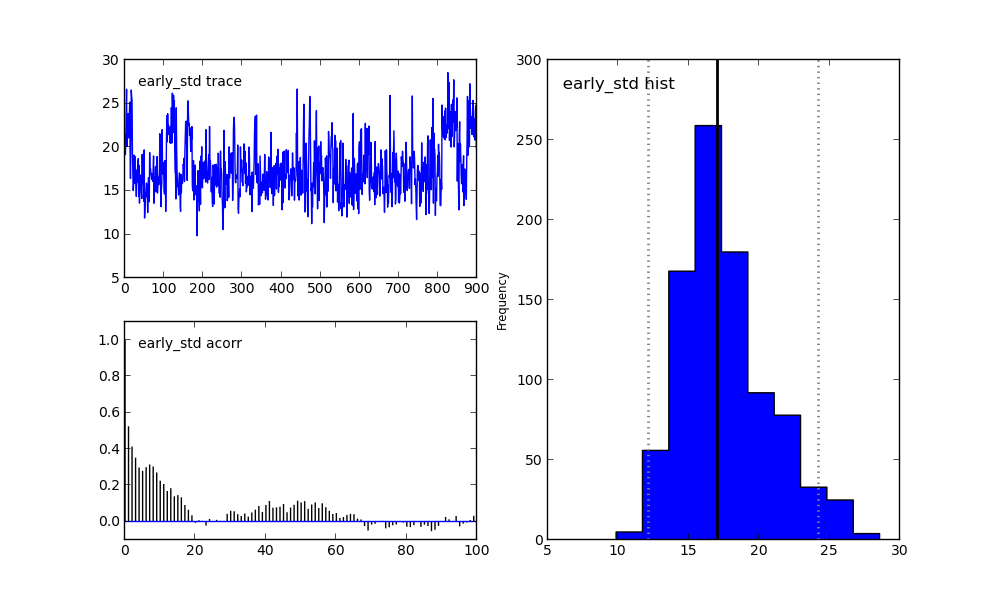
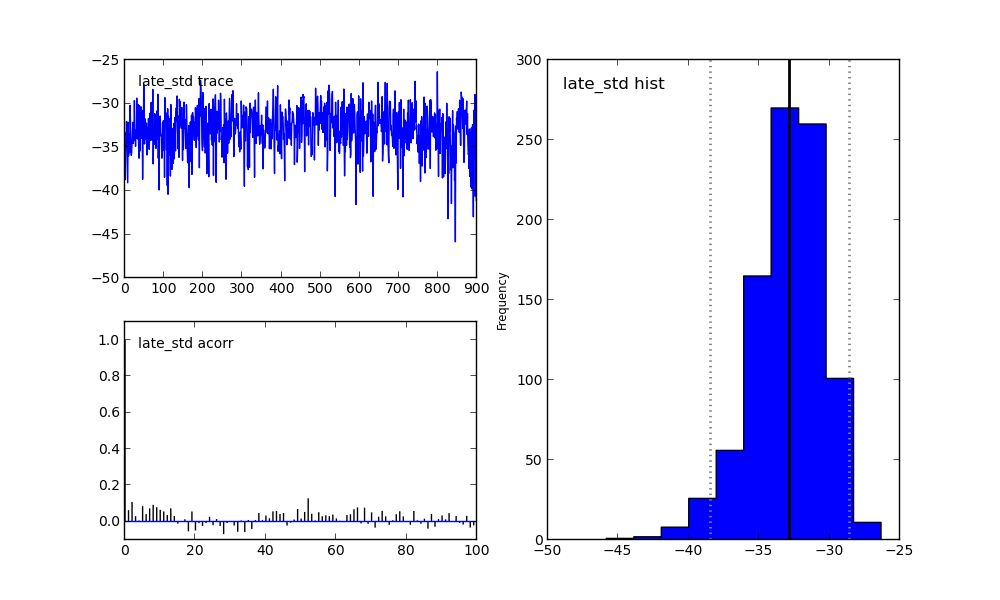
This does not work. If you look at the data I posted, the red line is drawn with the mean $v$ and should extend until the mode of $s$. By eye, it's fairly obvious that $s$ should lie somewhere around $s \approx 120$, but my program puts it at about $s \approx 40$. Here are the plots of the relevant parameters:


As a side note, I'm a bit puzzled with the fact that $\sigma_{late} < 0$, when my definition seems to exclude this part of parameter space.
Am I doing this correctly? Because I can find $s$ pretty well by eye, it would seem that finding $s$ shouldn't be that hard, and yet it has been. Is there something obviously wrong with my program? Is there another, non-Bayesian method for finding $s$?
