Context
I want to set the scene before somewhat expanding on the question.
I have longitudinal data, measurements taken on subjects approximately every 3 months, primary outcome is numeric (as in continuous to 1dp) in the range 5 to 14 with the bulk (of all data points) being between 7 and 10. If I do a spaghetti plot (with age on the x axis and a line for each person) it's a mess obviously as I have >1500 subjects, but there is a clear tread towards higher values with increased age (and this is known).
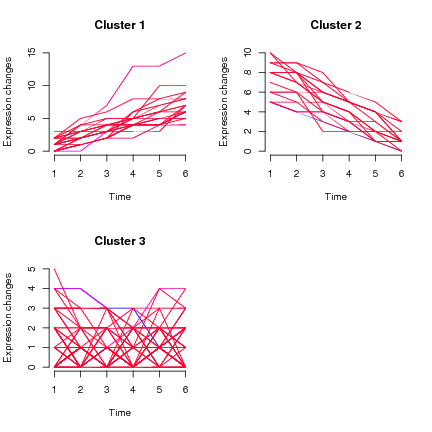
The broader question: What we would like to do is to firstly be able to identify trending groups (those that start high and stay high, those that start low and stay low, those that start low and increase to high etc) and then we can look at individual factors that are associated with 'trend group' membership.
My question here is specifically pertaining to the first portion, the grouping by trend.
Question
- How can we group individual longitudinal trajectories?
- What software would be suitable for implementing this?
I have looked at Proc Traj in SAS and M-Plus suggested by a colleague, which I'm looking into, but would like to know what others thoughts are on this.


kmlpackage - that seems to provide functionality you need. Paper in JoSS describes it in detail. Alsokml3d&kmlShapemight be of interest. $\endgroup$