18
$\begingroup$

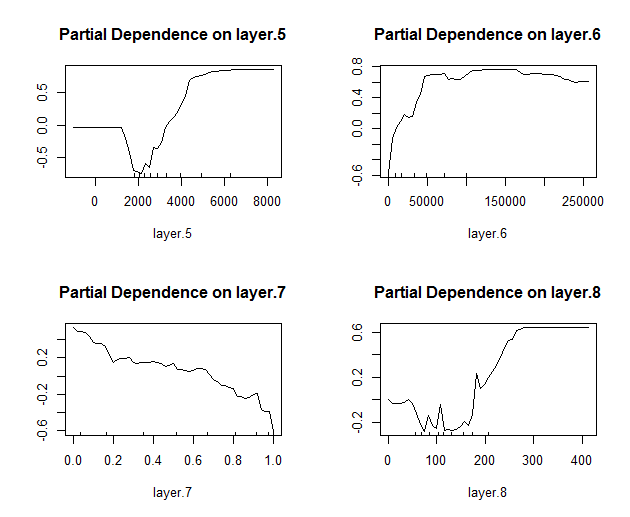
I am using the RandomForest R package and am confused at how to interpret the values of the Y-axis in their partial dependence plots. Help docs state that the plot is a "graphical depiction of the marginal effect of a variable on the class probability." However, I am still confused as to what exactly the y-axis represents.

  • Particularly, what do the negative values mean?
  • What does it mean to have a negative influence on accurately predicting the class?
  • And what is the most important feature from these figures, is it the max value, the shape of the trend etc?
  • Can you compare the partial plots with partial plots of other variables?
  • How might these plots compare with response curves created in Maxent (a distribution modeling software)?

Some example partial dependence plots

$\endgroup$

1 Answer 1

14
$\begingroup$

Answering these two first:

Particularly, what do the negative values mean? What does it mean to have a negative influence on accurately predicting the class?

If you look at the definition of how the partial plot is computed in the Random Forest package documentation, is says that the plots show the relative logit contribution of the variable on the class probability from the perspective of the model. In other words negative values (in the y-axis) mean that the positive class is less likely for that value of the independent variable (x-axis) according to the model. Similarly positive values mean that the positive class is more likely for that value of the independent variable according to the model. Clearly, zero implies no average impact on class probability according to the model.

And what is the most important feature from these figures, is it the max value, the shape of the trend etc?

There are many different approaches to determine feature importance and max absolute value is just one simple measure. Typically, people look at the shape of the partial plots to gather understanding about what the model is suggesting about the relationship from variables to class labels.

Can you compare the partial plots with partial plots of other variables?

The answer to this is less black and white. You can certain look at the range of the y-axis for each plot; If the partial dependence on one variable is near zero for the whole range of the variable, that tells you that the model does not have any relationship from the variable to the class label. Back to your question, the larger the range, the stronger the influence overall so in this sense they can be compared.

I have no experience with Maxent.
$\endgroup$
5
  • 1
    $\begingroup$ Say the model is for 2 class classification, how to determine what class is positive class and which is negative? $\endgroup$ Commented Sep 16, 2017 at 3:34
  • $\begingroup$ That's a good question, you'll have to experiment and see. The documentation says on page 17 here that if y is a factor then it assumes it's a classification problem. However it doesn't say which factor it will map to the positive class or negative class. I would hope that 1 or true is mapped to the positive class and 0, -1, or false is mapped to the negative class, but I wouldn't take that for granted in R. $\endgroup$
    – Chris A.
    Commented Sep 19, 2017 at 6:57
  • 2
    $\begingroup$ there is a which.class argument in partialPlot and it defaults to the first level of factor y. So if the first level of y is the negative case, then partialPlot will be predicting the negative cases, which might not be what one expects. $\endgroup$
    – qoheleth
    Commented Dec 12, 2017 at 4:41
  • $\begingroup$ Great answer. Just to be sure: are we talking about classification here? $\endgroup$
    – FrsLry
    Commented Apr 20, 2021 at 13:06
  • $\begingroup$ Yes, I assumed this from the original poster talking about class probabilities and classes. $\endgroup$
    – Chris A.
    Commented Apr 29, 2021 at 20:24

Your Answer

By clicking “Post Your Answer”, you agree to our terms of service and acknowledge you have read our privacy policy.

Not the answer you're looking for? Browse other questions tagged or ask your own question.