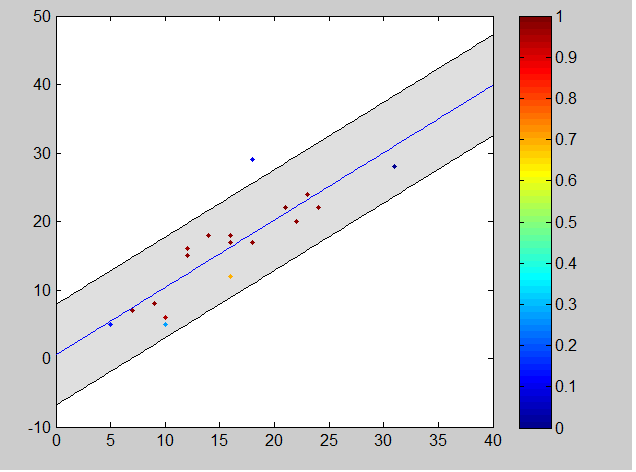
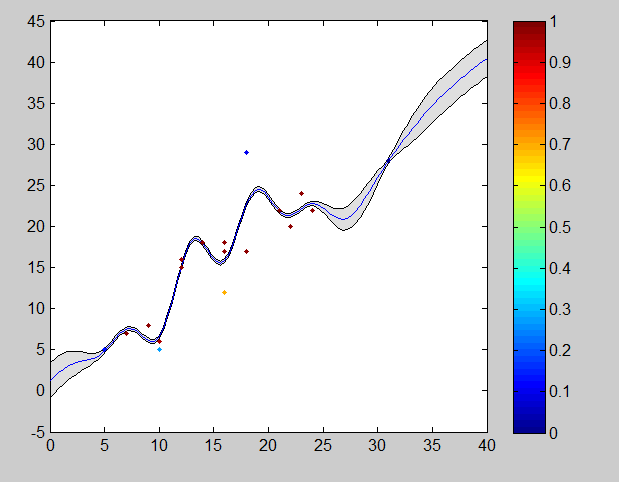
I am using the GPML matlab code found here. I have been using a squared exponential cov function with ARD. I am finding that if I use the minimise function to train the process I get uniform large vales for the output variance. I would expect the variance to be larger where there is no training values, however it is not. Could anyone give me an idea of where I might be going wrong?
I have included my code below:
clear all
close all
x=[14;21;18;23;24;22;16;16;16;9;10;7;12;18;31;12;10;5];
y=[18;22;29;24;22;20;18;17;12;8;6;7;15;17;28;16;5;5];

z = linspace(0, 40, 101)';

meanfunc = {@meanSum, {@meanLinear, @meanConst}};
covfunc =  @covSEard;
likfunc=@likGauss;
hyp2.cov = [1;0.1];
hyp2.lik = log(0.1);
hyp2.mean=[1;0.5];


hyp2 = minimize(hyp2, @gp, -100, @infExact, meanfunc, covfunc, likfunc, x, y);

nlml2 = gp(hyp2, @infExact, meanfunc, covfunc, likfunc, x, y);

[m s2] = gp(hyp2, @infExact, meanfunc, covfunc, likfunc, x, y, z);
f = [m+2*sqrt(s2); flipdim(m-2*sqrt(s2),1)];
fill([z; flipdim(z,1)], f, [7 7 7]/8)
hold on; plot(z, m); %plot(x, y, '+')

scatplot(x,y,'circles',1,[],[],1,[]);
I have also included the plots:
Firstly with the minimise function being used to optimise hyperparameters

And secondly without the minimise function being used:

