0
$\begingroup$

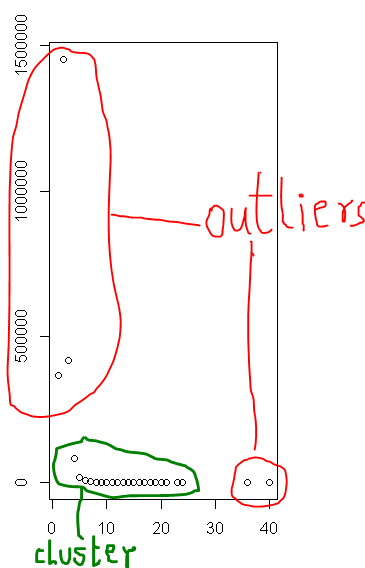
enter image description here

I have a frequency table (2 columns) of 20 rows of various transaction amounts. Some of these amounts are fraudulent in nature and are pretty obvious as they appear to be outliers in the scatter plot. I also want to break the data into clusters.

  • Is there a limit on the minimum data set required for clustering?
  • Can I use any specific technique?
  • What techniques can I use to identify the outliers?
$\endgroup$
3
  • 1
    $\begingroup$ Could you post the data, or scatterplot? The best kind of clustering depends on the data. See: stats.stackexchange.com/a/133694/82893 $\endgroup$ Commented Aug 20, 2015 at 15:29
  • $\begingroup$ The relationship here looks well behaved to me. It looks like a reciprocal relationship. Is there any reason something like that couldn't be the true relationship? Other than 'outlier-looking' nature of the data in the plot, is there any reason to think these really are outliers (eg, are these impossible values)? $\endgroup$ Commented Aug 30, 2015 at 17:00
  • $\begingroup$ Its more from a business point of view.Somebody should not be spending more than 20 dollars $\endgroup$
    – user40465
    Commented Aug 31, 2015 at 10:37

1 Answer 1

0
$\begingroup$

Why don't you use an outlier detection first, then do clustering second?

Also, there are clustering methods (not k-means) that have a notion of noise.

Experiment. Every data set is different. We don't have your data.

$\endgroup$

Your Answer

By clicking “Post Your Answer”, you agree to our terms of service and acknowledge you have read our privacy policy.

Not the answer you're looking for? Browse other questions tagged or ask your own question.