0
$\begingroup$

For a school project, we have to implement a linear regression with gradient descent. The data is the price of cars given the mileage, so at the end I should obtain a negative slope when I visualise the result.

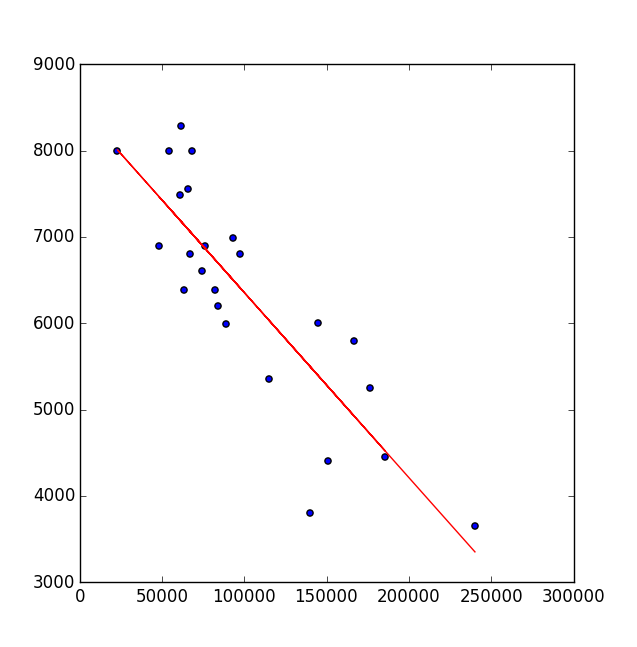
I tried to calculate the theta with the normal equation and it works like a charm : normal equation results
But when I use the gradient descent the theta change quickly for a positive slope that cut the data perpendicular to the expected slope then the thetas update become extremely slow : gradient descent results
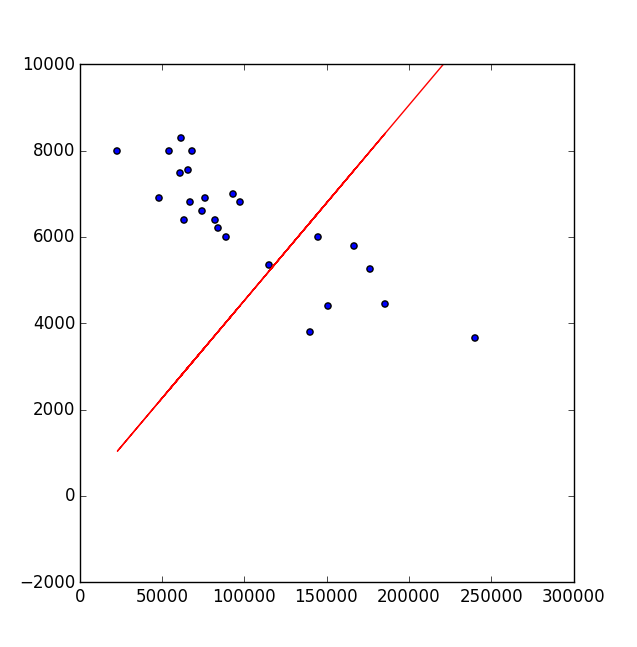
For the gradient descent I use a very small alpha (1e-10!) and I can't increase it, otherwise it failed by overshooting the cost function.

My problem is, I don't understand if (1) the problem is not well suited for gradient descent, (2) the data values are too big to converge quickly to the good solution or (3) another problem I don't think of.

Here is the python code of my function, I use numpy array as container:

def gradDescentIteration(X, y, theta, alpha, numIter):
   Xones = fll.append_bias(X).T # Append a column of 1 for the bias coefficient
   m = np.shape(y)[0]
   for i in xrange(numIter):
       H = np.dot(theta, Xones)
       diff = H - y.T
       diffm = np.dot(Xones, diff.T).T
       sigma = diffm * 1 / float(m)
       theta = theta - alpha * sigma
   return theta

Thanks for reading

Edit1 : dead link images

$\endgroup$
5
  • $\begingroup$ What happens if you add alpha*sigma instead of subtracting it? $\endgroup$
    – mpiktas
    Commented Sep 17, 2015 at 11:50
  • $\begingroup$ Also please make your code fully reproducible. $\endgroup$
    – mpiktas
    Commented Sep 17, 2015 at 11:52
  • $\begingroup$ It goes totaly wrong if I add alpha*sigma (theta0 = -3.04654024e+29 and theta1 = -3.88054332e+34) $\endgroup$ Commented Sep 17, 2015 at 12:01
  • $\begingroup$ What do you mean "fully reproducible" ? You mean the data ? It have several file for data loading and submission so it will not fit great here :/ $\endgroup$ Commented Sep 17, 2015 at 12:02
  • $\begingroup$ Fully reproducible, means that anyone can copy your code and immediately get the results. Use randomly generated data. $\endgroup$
    – mpiktas
    Commented Sep 17, 2015 at 12:25

1 Answer 1

1
$\begingroup$

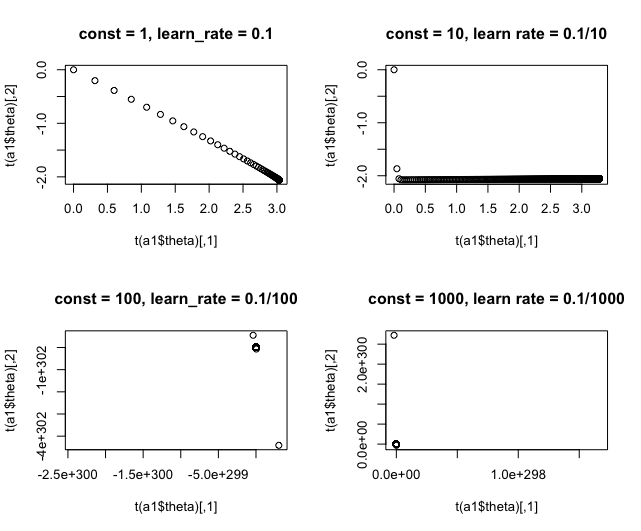
The issue is with the data range. For your data range you get bitten by numerical precision issues.

Here is an example R code reproducing the issue:

gendata <- function(const) {
    set.seed(13)
    x <- rnorm(100)*const
    y <- 3 - 2*x + rnorm(100) * const
    list(x = x, y = y)
}

gr_desc <- function(x, y, alpha, numIter) {
    X <- cbind(1,x)
    theta <- matrix(0, nrow = 2, ncol = numIter)
    gr <- matrix(NA, nrow = 2, ncol = numIter)
    n <- length(y)

    for (i in 2:numIter) {
        z <- X %*% theta[, i - 1]
        gr[, i] <- crossprod(X, y - z)
        theta[, i] <- theta[,i - 1] + alpha*gr[, i]/n
    }
    list(theta = theta, gr = gr)
}

par(mfrow=c(2,2))
d1 <- gendata(1)
a1 <- gr_desc(d1$x, d1$y, 0.1, 1000)
plot(t(a1$theta), main = "const = 1, learn_rate = 0.1")

d2 <- gendata(10)
a1 <- gr_desc(d2$x, d2$y, 0.1/10, 1000)
plot(t(a1$theta), main = "const = 10, learn rate = 0.1/10")

d3 <- gendata(100)
a1 <- gr_desc(d3$x, d3$y, 0.1/100, 1000)
plot(t(a1$theta), main = "const = 100, learn_rate = 0.1/100")

d4 <- gendata(1000)
a1 <- gr_desc(d4$x, d4$y, 0.1/1000, 1000)
plot(t(a1$theta), main = "const = 1000, learn rate = 0.1/1000")

I create the same data set, only multiply it by the constant, 1, 10, 100 and 1000. enter image description here

For this reason it is always advisable to standardize your data. Numerical optimisation methods usually use some sort of safeguards to avoid such issues.

$\endgroup$
3
  • $\begingroup$ I scale the data with X = (X - min(X)) / (max(X) - min(X)) and the gradient descent went way faster. Thanks for the exemples ! Since I do that I have to scale in the same way new input submitted for estimation. Or there is a way to convert the thetas to avoid the rescalling process when I receive new inputs data ? $\endgroup$ Commented Sep 17, 2015 at 15:07
  • 1
    $\begingroup$ For regression look into standardized regression coefficients. If you subtract mean from all the variables and divide by standard deviation, and then fit the regression, you can recover the original coefficients. $\endgroup$
    – mpiktas
    Commented Sep 18, 2015 at 5:33
  • $\begingroup$ Thank you again after a quick search I get this stats.stackexchange.com/questions/74622/…. Seems to be what I need $\endgroup$ Commented Sep 18, 2015 at 8:52

Your Answer

By clicking “Post Your Answer”, you agree to our terms of service and acknowledge you have read our privacy policy.

Not the answer you're looking for? Browse other questions tagged or ask your own question.