I'm a computer science student and statistics isn't my strong suite. I would appreciate some help.
I did a task performance experiment for my Master's thesis to validate my "special secret algorithm". Here's an overview:
- I had 20 test subjects shoot at a moving target repeatedly.
- I recorded if it was a HIT or a MISS.
- There were 3 types of scenarios: "easy", "hard" and a "special" one. The "easy" and "hard" scenarios were kind of control cases. I guess the choice of scenario was my independent variable.
- First there was a training phase that adjusted the overall difficulty (target speed) for each test subject such that neither easy nor hard scenario hit rates would be too close to 0% or 100%. I optimized so that: (hardHitRate - easyMissRate) = 0.
- After finding the overall difficulty level, each test subject was presented with 225 targets for each 3 scenarios for a total of 675 targets in random order.
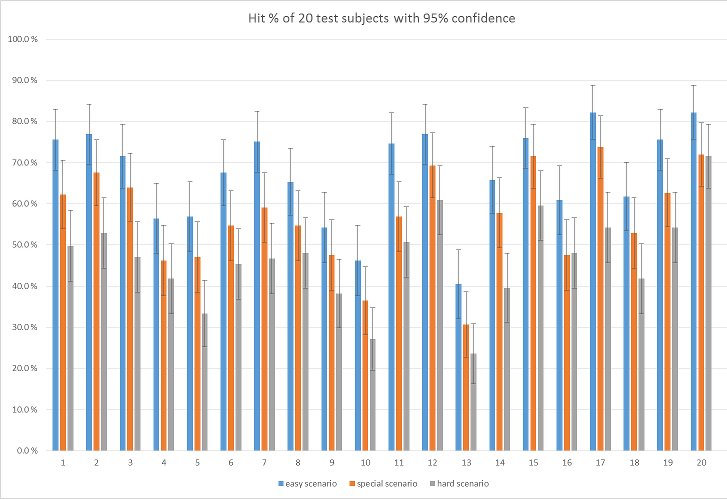
The error bars were calculated with Normal approximation interval formula with z=1.96 (95% confidence).
With the exception of 16 and 20, all the other "special" bars fall nicely between the "easy" and "hard" bars. Intuitively it seems clear to me that my "special" scenario is easier than the "hard" scenario, while not as easy as the "easy" scenario.
I guess my null hypothesis should be that the hit rate for the "special" scenario is not significantly better than for the "hard" scenario.
How would I go about disproving that? I know I need to somehow combine the results of all the 20 persons. The trouble is that they are not directly comparable because the overall difficulty setting and personal skill level were different for each test subject. Only the relative performance of the three scenarios are comparable to each other.

