3
$\begingroup$

I am trying to write a Monte Carlo simulation in R and I am really stuck! I want to know the probability distribution of a random person in the UK becoming ill from eating a cooked 100g piece of chicken.

I have the following information: out of 1000 pieces of chicken tested 20 had bacteria in question and I have data for the $\log_{10}$ counts of these 20 pieces, I also have min and max $\log_{10}$ counts (0.1 and 3.0). I also know the average person in UK eats 2 x 100g portions of chicken a week. The model for risk of illness given an ingested number of the bacteria is predicted by $R=1-\exp(-aD)$ where $D$ is the ingested number of organisms and I have a value for $a$.

I can write basic Monte Carlo simulations but I am struggling with the start of this one as I can't get my head around the model being ingested bacteria and the question being risk from eating a 100g portion.

  • Is my first step here to obtain the CDF?
  • And what is the distribution I should use?
$\endgroup$
6
  • $\begingroup$ I think you have to explain this a bit more, what exactly are you trying to do. An example or a sample of your data would be also nice. $\endgroup$
    – ECII
    Commented Oct 30, 2011 at 14:32
  • $\begingroup$ this is what I have so far my sample data is d. I am trying to firstly derive the probability distrubution for the risk (R) of a random person in GB becoming ill from eating a 100g portion of cooked chicken. then secondly using the mean of this probabilty distribution estimate the annual risk to the average person in GB. $\endgroup$
    – Jan
    Commented Oct 30, 2011 at 15:10
  • $\begingroup$ d<-c(1.158469, 2.01743, 1.896469, 1.055511, 1.263673,1.616196, 1.197719, 0.913197, 1.108193, 2.058633,0.904878, 1.241663, 1.525408, 1.730925, 1.143274, 1.200265, 1.103152, 1.465076, 1.838127, 1.162226) alpha<-0.00005 d<-sort(d) dcdf<-getecdf*(d) mind<-0.1 maxd<-3.0 rd<-rcumul(5000,d,dcdf,mind,maxd) R<-1-exp(-alphard) plot(ecdf(R), do.p=FALSE,verticals=TRUE, main="Risk of illness",xlab="Risk") qts<-seq(0,1,0.05) quantile(R,qts) mean(R) $\endgroup$
    – Jan
    Commented Oct 30, 2011 at 15:14
  • $\begingroup$ where I have getecdf this will relate to the function which will generate the distribution and then generate the random values for this type of thing>>>this is the part I am confused with $\endgroup$
    – Jan
    Commented Oct 30, 2011 at 15:16
  • $\begingroup$ right I now see that the risk formula is obviously a form of the exponential distribution but im still not sure how to write the function to generate distribution and random values $\endgroup$
    – Jan
    Commented Oct 30, 2011 at 15:35

3 Answers 3

4
$\begingroup$

Here is what I would do, in a two-steps answer to make things clearer. I suppose you want to compute the annual risk of getting sick (at least once). I propose a simple bootstraping procedure.

First, without resampling

Using your formula $r = 1- e^{-a d}$, you can compute the risk of disease $r_i$ for each of the 1000 pieces of chicken tested. You can estimate the risk $p$ of disease when eating one piece of chicken as the mean of the $r_i$’s. Here is a piece of code for that:

d<-c( rep(0,1980), c(1.158469, 2.01743,  1.896469, 1.055511, 1.263673, 1.616196, 
 1.197719, 0.913197, 1.108193, 2.058633, 0.904878, 1.241663, 1.525408, 1.730925, 
 1.143274, 1.200265, 1.103152, 1.465076, 1.838127, 1.162226) )

a <- 0.00005

R <- 1-exp(-a*d)
p <- mean(R);

The result is $p = 6.9 \cdot 10^{-7}$. If you estimate that the average person eats $104$ pieces of chicken a year, her/his probability of disease in a year is $1-(1-p)^{104} \simeq 104 p = 7.17 \cdot 10^{-5}$.

Now, let’s resample

First, the risk estimation is dependent of your sample of 1000 pieces of chicken. Let’s resample it:

d1 <- sample(d,1000,replace=TRUE)
R1 <- 1-exp(-a*d1)
p1 <- mean(R1);

Then, model the number of chicken pieces the guy eats in a year by a Poisson $\mathcal P(104)$.

N <- rpois(1,104)

The probability of getting sick in a year is then

p2 <- 1-(1-p1)**N

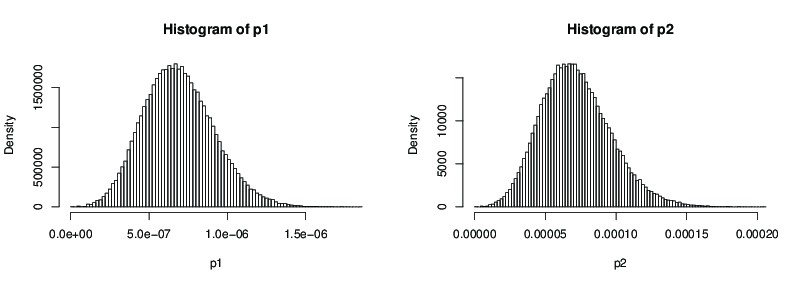
Just put all that in a loop of length 100000 and record the values, you’ll get a distribution of $p_1$ and $p_2$. You can plot a histogram:

histograms

You could also fit a Beta distribution on these...

$\endgroup$
2
  • 1
    $\begingroup$ Can someone explain me why this old question was suddenly on top? $\endgroup$
    – Elvis
    Commented Jan 2, 2012 at 14:27
  • $\begingroup$ @whuber good point about variability vs uncertainty. I was just wondering could you example a little more by what you mean "then solve the inference problem". Do you mean solve and explain it in a discussion sense here or find an actual estimate from the given data which I wasn't sure was possible (before simulation) ? If so how would you go about doing this with the presented data. $\endgroup$
    – user63230
    Commented Dec 20, 2019 at 13:39
0
$\begingroup$

Here my 2 cents. When 20/1,000 samples are contaminated, you could use a Poisson distribution to model the event of a person eating a contaminated sample (mind the difference between the weight of a sample in the lab and on your plate).

When a Monte Carlo sample is simulated to be positive in the previous step, you can then simulate the ingested number of bacteria using the empirical distribution of your 20 values, or fit for example an exponential distribution. In the latter case, have a look at the fitdistrplus package. In the former case, you could do it as follows:

Fn <- ecdf(d)
random_samples <- quantile(x=Fn, prob=runif(n=1e05, min=0, max=1))

Take care that you transfer your units correctly (log values, sample weights, etc.) and realize that this simulation is only a very crude approximation of what happens in reality.

$\endgroup$
0
$\begingroup$

Here my 2 cents as well! With the given information, the probability distribution of D can be derived as follows:

Pr(D)=Pr(D|Contaminated)*P(Contaminated)

We can estimate Pr(Contaminated)=20/1000=1/50. For Pr(D|Contaminated) a simple histogram suggests a Poisson like distribution. But you can fit another distribution. However, for count data it is customary to use Poisson or Binomial distributions.

Once you have the distribution for D, you can sample from it and plugin in the risk of illness, R(D). This risk can be interpreted as the probability of been sick in one trial (i.e. eating a piece). Then the distribution of been sick follows S ~ Binomial(R(D),2) if each piece is 100g. The probability for one person to be sick in one week is then Pr(S=1)=2*R(D)*[1-R(D)].

To summarize:

  1. Fit a distribution to your D s (10^d from you comments). Possibly a Poisson.
  2. Sample a value from this distribution (truncate if necessary to take into account the minimum and the maximum).
  3. Compute 2*R(D)*[1-R(D)]
  4. Go to step 2
$\endgroup$

Your Answer

By clicking “Post Your Answer”, you agree to our terms of service and acknowledge you have read our privacy policy.

Not the answer you're looking for? Browse other questions tagged or ask your own question.