3
$\begingroup$

I have a number of univariate time series that I would like to incorporate in a production system. I have daily data from a month and I would like to forecast every day the corresponding values for the next week (horizon=7) for each time series. Every day new data arrives, so I can rebuild all models with the updated values.

I have a number of competing methods (e.g. auto.arima, ets or ensembles) and I would like to select the best method every day in an automated way. My first thought was, at day $d$ to use the daily data for days $1, \ldots, d-8$ to build the models and compare out-of-sample forecast accuracies on days $d-7, \ldots, d$, and then pick the best model every day. I am sure that this is not the right thing to do (probably increased variance in predictions).

Is there any reference on how to use such models in a production system? I did not manage to find anything relevant.

$\endgroup$
2
  • $\begingroup$ why not using the average of the predictions by each model? or a weighted average given each model's performance based on the metric used to select each model? i am curious if you managed to solve this problem. $\endgroup$
    – darXider
    Commented Nov 24, 2016 at 15:54
  • $\begingroup$ with many parallel time series look into hierarchical time series: stats.stackexchange.com/questions/31473/… $\endgroup$ Commented Mar 21, 2020 at 16:23

1 Answer 1

0
$\begingroup$

I'm barely a student in his internship, so I don't have a lot of experience, but I am facing a similar issue with a project I'm having at my work. I use an extremely unorthodox method, but one cannot just do 5000 forecasts manually. The way I would approach this is as follows:

  1. I created 2 functions that choose best model fits for SARIMA and ets() wrapper to find best models for each family according to AIC(I use MAPE).
  2. I choose the model fits that score best from each of the model family(SARIMA/ETS) and perform out of sample forecasting
  3. Then, I compare the out of sample accuracy measures(MAPE/RMSE) between the 2 and choose the best scoring one with its parameters or orders.
  4. Ultimately, I forecast the desired horizon
  5. When new data comes in, my code automatically takes in consideration the newest data points and thus, updates the models.

My method does not take in consideration assumptions. I know this is quite counter-intuitive, but I'm creating a score or so to filter out unsatisfactory forecasts. Although there are more than 5000 different time series, it is known that in many cases the data is either missing or consists of unpredictable series, hence, expectations are not high.

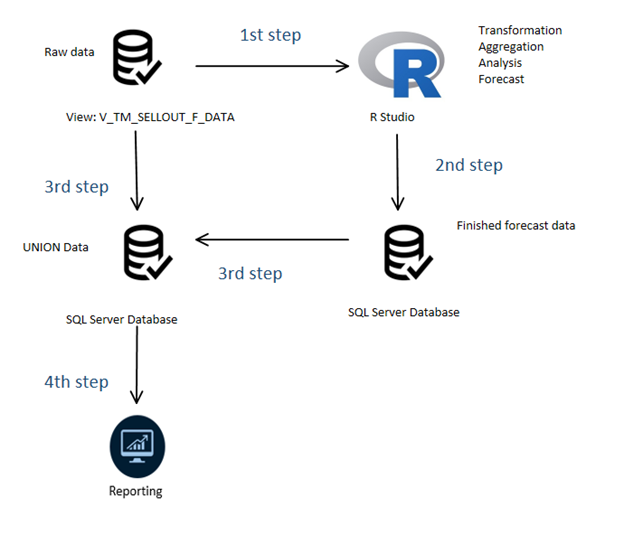
My data is imported from SQL Server to RStudio. Here, the code splits each data set into lists of train and test sets that will be used for choosing a model. After choosing the best model, I perform the forecast which will be ultimately pushed into SQL Server to be used for reporting/visualizations.

rough depiction of the flows

$\endgroup$

Your Answer

By clicking “Post Your Answer”, you agree to our terms of service and acknowledge you have read our privacy policy.

Not the answer you're looking for? Browse other questions tagged or ask your own question.